
 Still Justify Its Price After Recent Share Pullback?")
If you are wondering whether Tesla’s share price still reflects its true worth, the numbers around recent returns and current valuation raise some important questions. Tesla closed at US$380.85, with returns of a 4.6% decline over 7 days, a 7.5% decline over 30 days, a 13.1% decline year to date, but a 32.2% gain over 1 year, 101.3% over 3 years, and 79.8% over 5 years that many investors will be trying to put into context. Recent headlines have focused on Tesla’s position in the electric vehicle industry and broader market sentiment around growth oriented companies, which can strongly influence how investors view the stock’s risk and reward. These themes often sit behind sharp moves in share prices, even when the underlying business story changes more slowly. According to Simply Wall St’s valuation model, Tesla currently has a valuation score of 0 out of 6. The following sections will compare different valuation approaches, before finishing with a way to look at valuation that can give you a more complete picture.
Tesla scores just 0/6 on our valuation checks. See what other red flags we found in the full valuation breakdown.
Approach 1: Tesla Discounted Cash Flow (DCF) Analysis
A Discounted Cash Flow, or DCF, model takes a series of future cash flow projections and discounts them back to today to estimate what the business might be worth right now.
For Tesla, the model used is a 2 Stage Free Cash Flow to Equity approach, based on cash flows in US$. The latest twelve month free cash flow is about $5.3b. Analysts provide free cash flow estimates out to 2030, where free cash flow is projected at $27.1b, with additional years extrapolated by Simply Wall St rather than based on direct analyst forecasts.
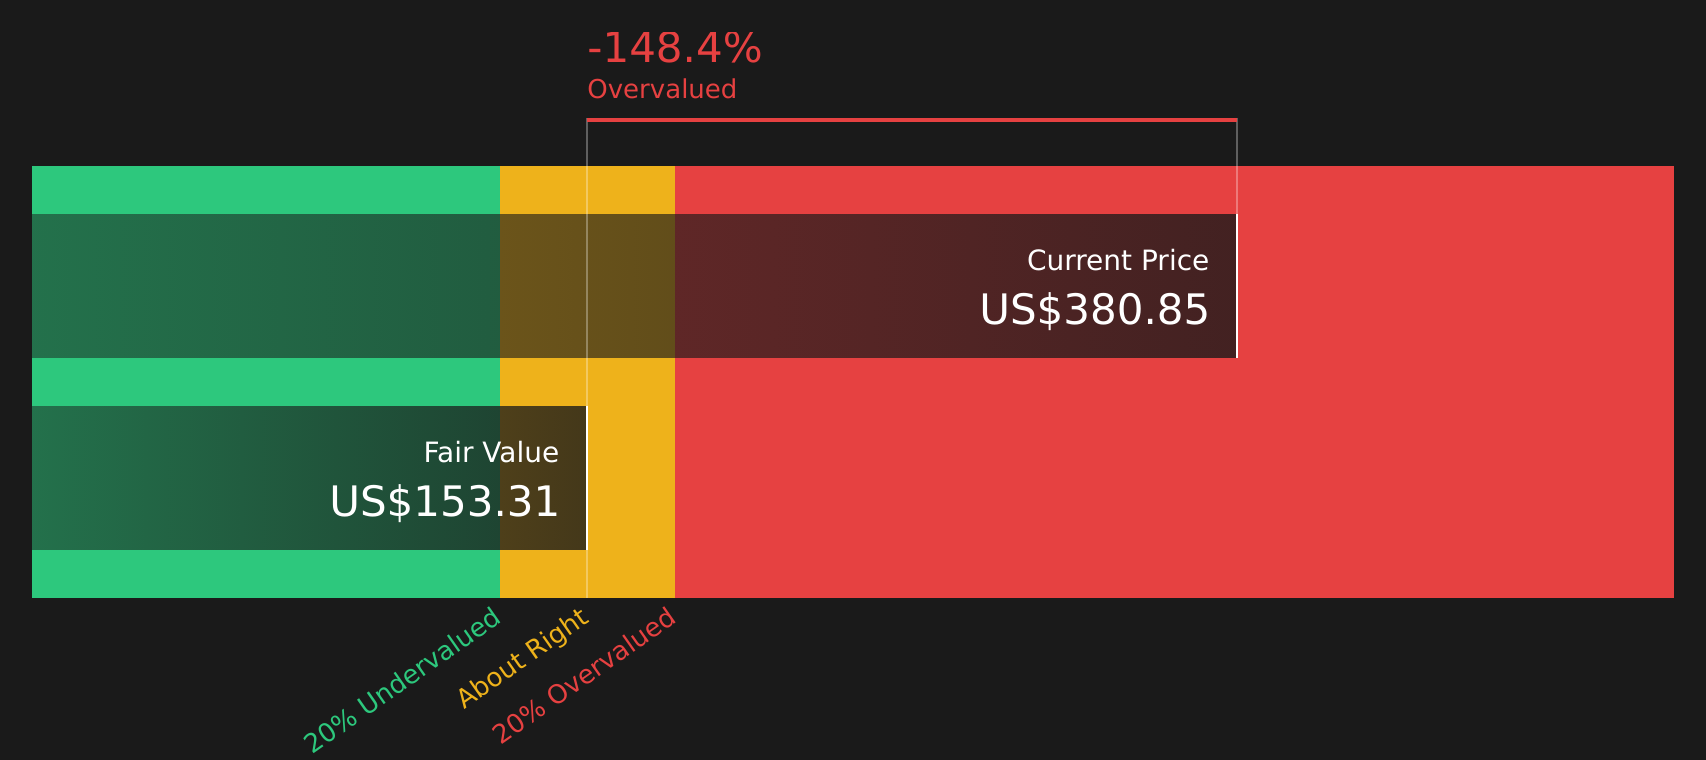
After discounting these projected cash flows back to today, the model arrives at an estimated intrinsic value of about $153.31 per share. Compared with the recent share price of US$380.85, this implies the stock is 148.4% above the DCF estimate. On this metric, Tesla screens as overvalued rather than fairly priced or undervalued.
Result: OVERVALUED
Our Discounted Cash Flow (DCF) analysis suggests Tesla may be overvalued by 148.4%. Discover 55 high quality undervalued stocks or create your own screener to find better value opportunities.
 TSLA Discounted Cash Flow as at Mar 2026
Approach 2: Tesla Price vs Sales
For profitable companies where earnings can be quite volatile, many investors look at the Price to Sales, or P/S, ratio because revenue is often more stable than earnings and still reflects the scale of the business.
In general, higher growth expectations and lower perceived risk can justify a higher P/S ratio, while slower growth and higher risk usually point to a lower, more conservative multiple. That is why simply looking at the headline number in isolation can be misleading.
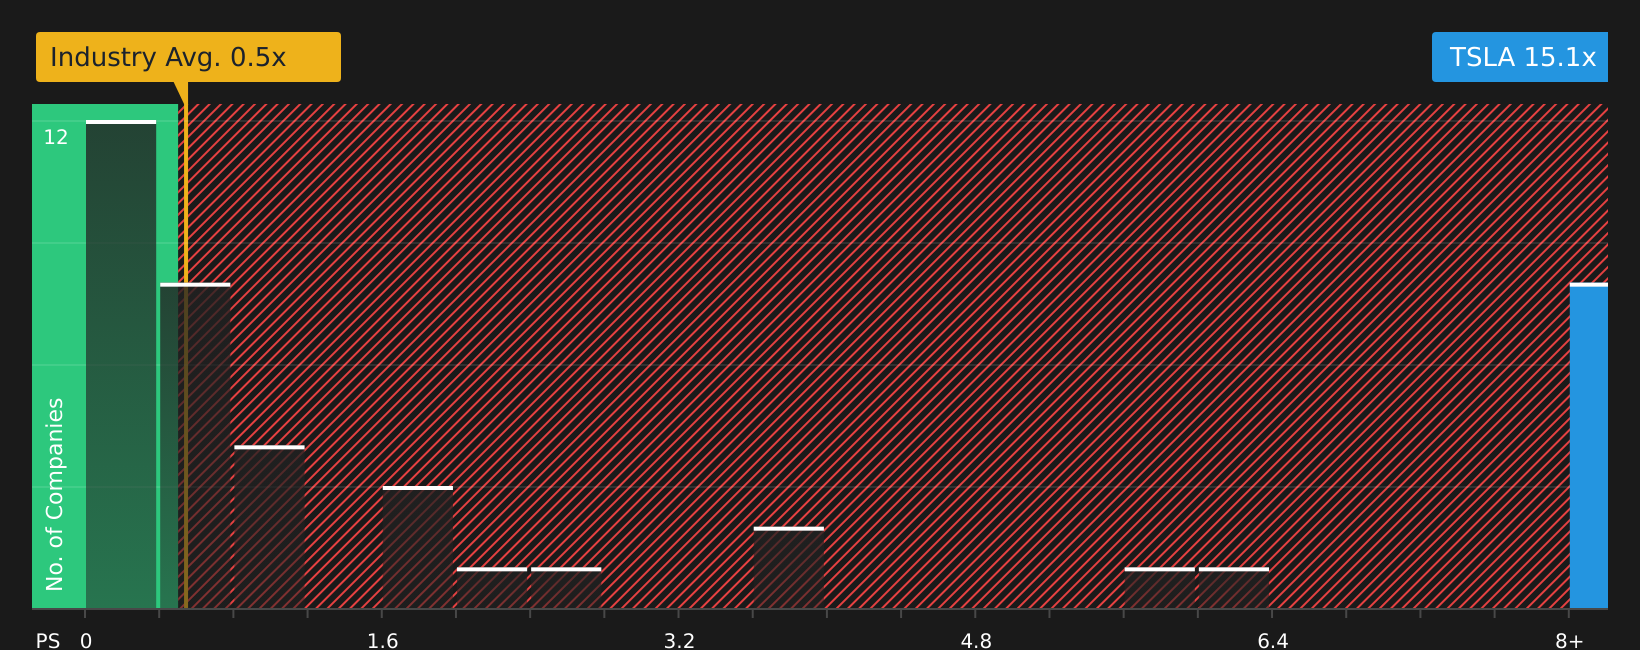
Tesla currently trades on a P/S ratio of 15.07x, compared with the Auto industry average of 0.53x and a peer average of 1.33x. Simply Wall St also calculates a proprietary “Fair Ratio” of 3.13x, which is the P/S multiple suggested by factors such as Tesla’s earnings growth profile, profit margins, industry, market cap and risk characteristics.
This Fair Ratio can give you a more tailored reference point than broad industry or peer comparisons because it adjusts for company specific fundamentals rather than assuming one size fits all. When Tesla’s actual P/S of 15.07x is set against the Fair Ratio of 3.13x, the stock screens as trading well above that model based reference level.
Result: OVERVALUED
 NasdaqGS:TSLA P/S Ratio as at Mar 2026
P/S ratios tell one story, but what if the real opportunity lies elsewhere? Start investing in legacies, not executives. Discover our 20 top founder-led companies.
Upgrade Your Decision Making: Choose your Tesla Narrative
Earlier this article highlighted that there is an even better way to think about valuation. Narratives offer that approach because they let you attach a clear story to your numbers by combining your view on Tesla’s future revenues, earnings and margins with a fair value you think makes sense.
A Narrative on Simply Wall St is essentially your version of Tesla’s story, translated into a financial forecast and a fair value. This way, you are not just reacting to the share price. You are tracking whether your story still lines up with the data.
You can find these Narratives on Simply Wall St’s Community page, where millions of investors share them in an accessible format. This format avoids complex modelling but still ties assumptions about growth, profitability and risk back to a single fair value per share.
Once you have a Narrative, it becomes a decision tool. You can compare your fair value to today’s price to help decide whether Tesla appears expensive, inexpensive or roughly in line with your expectations. That comparison updates automatically as new news or earnings arrive.
The recent Tesla Narratives in the Community illustrate the range of views. One fair value is near US$75 per share, while another is around US$2,500 per share. This shows how different investors can look at the same company and reach very different conclusions based on the story they believe.
For Tesla, however, we will make it really easy for you with previews of two leading Tesla Narratives:
Fair value: US$2,707.91 per share
Implied undervaluation vs US$380.85: about 86% below this fair value estimate
Revenue growth used in the model: 77%
Breaks Tesla into five segments, including Optimus robots, energy storage, FSD and software, core automotive, and solar and grid solutions, then builds a consolidated 2030 view. Projects very large 2030 revenue and profit, then applies bear, base and bull P/E multiples to arrive at a fair value range between roughly US$2,120 and US$4,240 per share. Frames Tesla as potentially very undervalued if it fully delivers on AI, FSD and energy ambitions, while still flagging execution, competition and regulation as key risks.
Fair value: US$322.21 per share
Implied overvaluation vs US$380.85: about 18% above this fair value estimate
Revenue growth used in the model: 18%
Centers on Tesla as a tech focused automaker with Dojo, FSD and Megapack energy storage as major drivers, but applies more moderate assumptions to future revenue and margins. Uses P/S as the main tool, with the view that the current multiple already reflects high expectations for automotive, energy storage and services such as Supercharger licensing. Highlights risks around Tesla Vision, regulatory scrutiny of self driving, execution on energy storage capacity and potential limits to how far valuation multiples can stretch.
Taken together, these two Narratives show how different fair value assumptions can be built from the same starting point using clear revenue, margin and multiple inputs rather than relying on the latest share price move.
Do you think there’s more to the story for Tesla? Head over to our Community to see what others are saying!
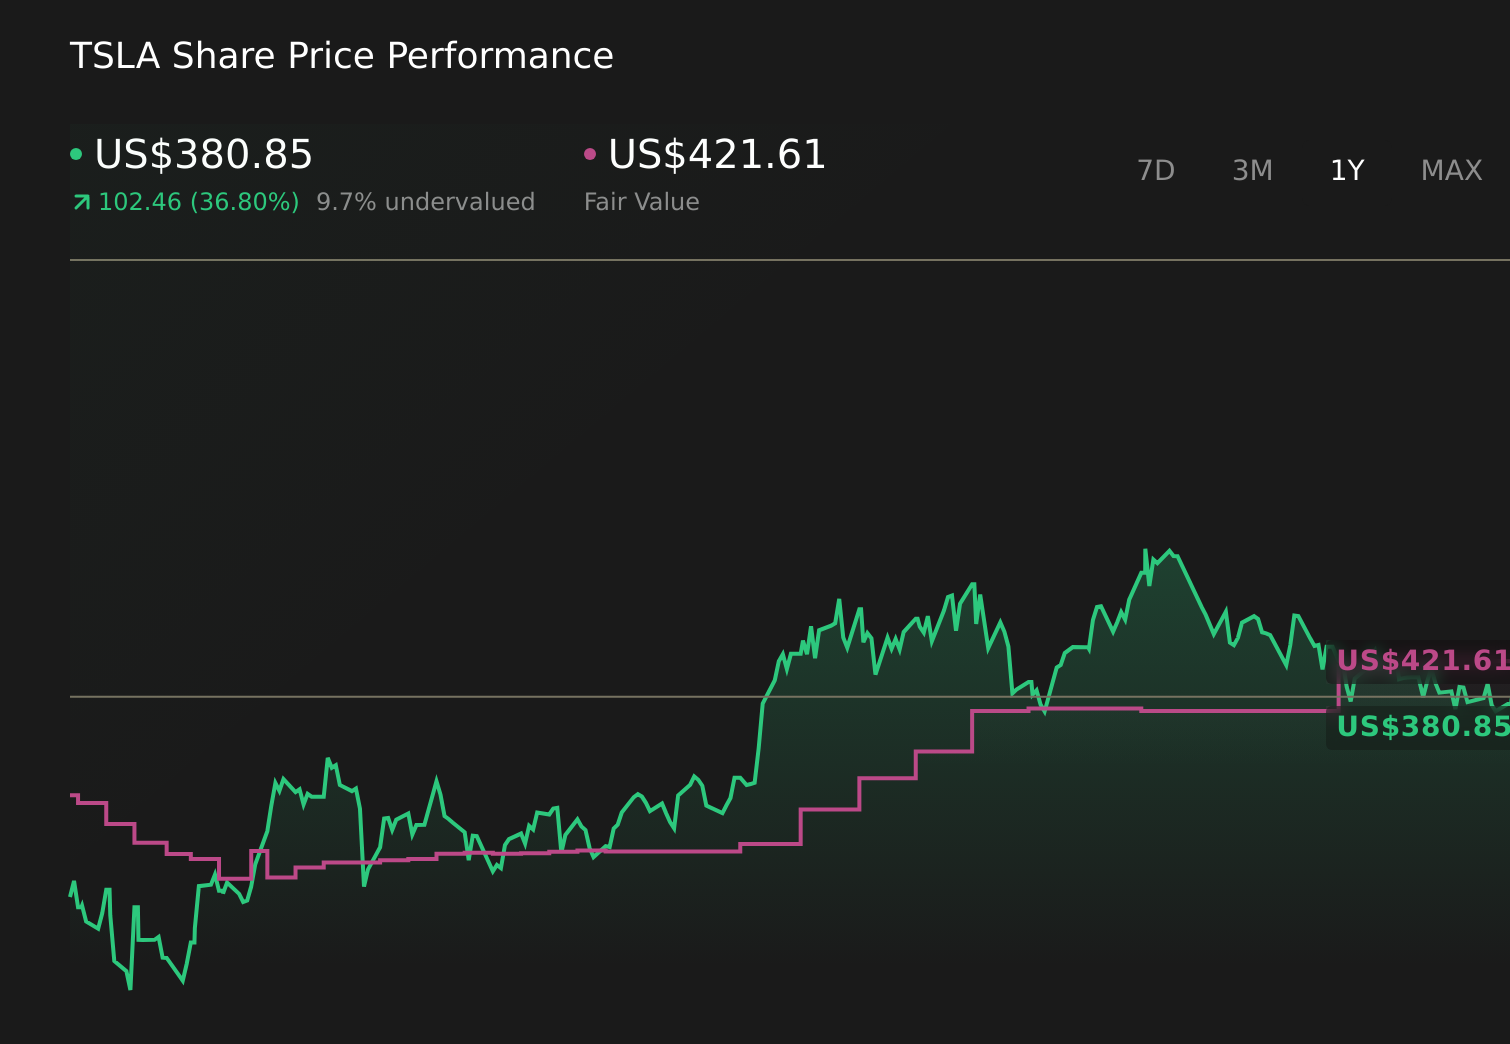 NasdaqGS:TSLA 1-Year Stock Price Chart
This article by Simply Wall St is general in nature. We provide commentary based on historical data
and analyst forecasts only using an unbiased methodology and our articles are not intended to be financial advice. It does not constitute a recommendation to buy or sell any stock, and does not take account of your objectives, or your
financial situation. We aim to bring you long-term focused analysis driven by fundamental data.
Note that our analysis may not factor in the latest price-sensitive company announcements or qualitative material.
Simply Wall St has no position in any stocks mentioned.
Valuation is complex, but we’re here to simplify it.
Discover if Tesla might be undervalued or overvalued with our detailed analysis, featuring fair value estimates, potential risks, dividends, insider trades, and its financial condition.
Have feedback on this article? Concerned about the content? Get in touch with us directly. Alternatively, email editorial-team@simplywallst.com


