
 Pricing Too Much Future Growth After Recent Share Price Pullback?")
If you have ever looked at Tesla and wondered whether the current share price matches the story, this article focuses squarely on what that price actually implies. Tesla shares last closed at US$396.73, with a 1.4% decline over the past week, a 3.5% decline over the past month, a 9.4% decline year to date, a 51.0% return over the past year, and 128.7% over three years. Recent Tesla headlines have ranged from product updates to ongoing discussions about competition in electric vehicles and energy solutions. These developments are helping shape how investors think about the company and provide useful context for a share price that has pulled back in the short term while still sitting on strong multi year returns. Right now, Tesla has a valuation score of 0 out of 6 on Simply Wall St’s checklist of potential undervaluation. This sets up an interesting comparison across different valuation methods and a final section on an even more complete way to think about what the stock might be worth.
Tesla scores just 0/6 on our valuation checks. See what other red flags we found in the full valuation breakdown.
Approach 1: Tesla Discounted Cash Flow (DCF) Analysis
A Discounted Cash Flow, or DCF, model takes estimates of the cash Tesla could generate in the future and discounts those back to what they might be worth in today’s dollars. It is a way of asking what you would be willing to pay now for those potential future cash flows.
For Tesla, the model used here is a 2 Stage Free Cash Flow to Equity approach. The company’s latest twelve month free cash flow is reported at about $5.3b. Analysts provide a set of cash flow estimates for the coming years, and Simply Wall St extends these further out, with projected free cash flow reaching $27.1b in 2030, all in US$ terms.
After discounting each of those projected cash flows back to today, the DCF output suggests an estimated intrinsic value of about $152.12 per share. Compared with the recent share price of $396.73, this DCF view implies the stock is 160.8% above that estimate, which points to Tesla trading well above this particular model’s fair value range.
Result: OVERVALUED
Our Discounted Cash Flow (DCF) analysis suggests Tesla may be overvalued by 160.8%. Discover 49 high quality undervalued stocks or create your own screener to find better value opportunities.
 TSLA Discounted Cash Flow as at Mar 2026
Approach 2: Tesla Price vs Sales (P/S)
For profitable companies that are still heavily focused on expanding revenue, the P/S ratio is a useful way to think about what investors are paying for each dollar of sales, especially when earnings can be affected by investment and accounting choices.
What counts as a normal or fair P/S ratio is influenced by how quickly investors expect a company’s revenue to grow and how much risk they see in that growth. Higher expected growth or lower perceived risk can justify a higher multiple, while slower expected growth or higher risk usually calls for a lower one.
Tesla currently trades on a P/S of 15.70x. That sits well above the Auto industry average of 0.58x and the peer average of 1.33x. Simply Wall St’s Fair Ratio for Tesla is 3.29x. This is its proprietary view of what the P/S might be, given factors such as earnings growth, industry, profit margin, market cap and key risks. This Fair Ratio can be more helpful than a simple peer or industry comparison because it attempts to adjust for those company specific characteristics instead of assuming all Auto companies deserve similar multiples. With Tesla’s actual P/S well above the 3.29x Fair Ratio, the shares look expensive on this measure.
Result: OVERVALUED
 NasdaqGS:TSLA P/S Ratio as at Mar 2026
P/S ratios tell one story, but what if the real opportunity lies elsewhere? Start investing in legacies, not executives. Discover our 20 top founder-led companies.
Upgrade Your Decision Making: Choose your Tesla Narrative
Earlier we mentioned that there is an even better way to understand valuation, so let us introduce you to Narratives, which are simply the stories investors tell about a company, tied directly to their own fair value, revenue, earnings and margin assumptions.
On Simply Wall St, Narratives live in the Community page and give you an accessible way to connect Tesla’s story to numbers. This allows you to see how a view about electric vehicles, AI or robots turns into a financial forecast and then into a fair value that you can compare with today’s US$396.73 share price.
Each Narrative sets out a clear thesis and a fair value, then updates automatically when new data arrives. When Tesla reports earnings or new headlines hit, the cash flow estimates, P/E, margins and fair value behind that story move with the facts instead of staying frozen.
For Tesla, that can mean one investor argues it should be worth US$5.46 per share while another puts fair value at US$2,500. By comparing those two Narratives side by side you can see exactly how different assumptions on robotaxis, Optimus and the core auto business lead to very different fair values, helping you decide whether the current market price is above or below your own view of what Tesla is worth.
For Tesla however we will make it really easy for you with previews of two leading Tesla Narratives:
 Tesla Bull Case
Fair value in this bullish Narrative: US$2,707.91 per share
Implied undervaluation vs the recent US$396.73 share price: about 85% below this Narrative fair value
Revenue growth assumption: 77%
Frames Tesla as a broad technology platform across AI, robotics, software and energy, rather than just an automaker. Builds a 2030 view by splitting Tesla into five lines of business, then applies P/E ranges to arrive at a wide span of 2030 market caps. Backs into today’s value by discounting those 2030 cases, producing fair value estimates in the low thousands per share, while still flagging execution, competition and regulation as key risks.
 Tesla Bear Case
Fair value in this more cautious Narrative: US$322.21 per share
Implied overvaluation vs the recent US$396.73 share price: about 23% above this Narrative fair value
Revenue growth assumption: 18%
Focuses on Tesla as a tech driven business built on AI computing power, self driving and large scale energy storage, with Dojo, FSD and Megapack at the core. Highlights both the potential of Autopilot, FSD, Optimus and Megapack and the hurdles around safety concerns, regulation, sensor choices and public adoption of autonomous driving. Uses more moderate growth and profitability assumptions to arrive at a fair value close to US$322, and treats recent Cybercab and robotaxi updates as reasons to be cautious on timelines rather than changing the valuation.
Taken together, these two Narratives show how different assumptions on Tesla’s growth, margins and end markets can lead to very different fair values. This gives you a structured way to decide where your own view sits relative to the current share price.
Curious how numbers become stories that shape markets? Explore Community Narratives
Do you think there’s more to the story for Tesla? Head over to our Community to see what others are saying!
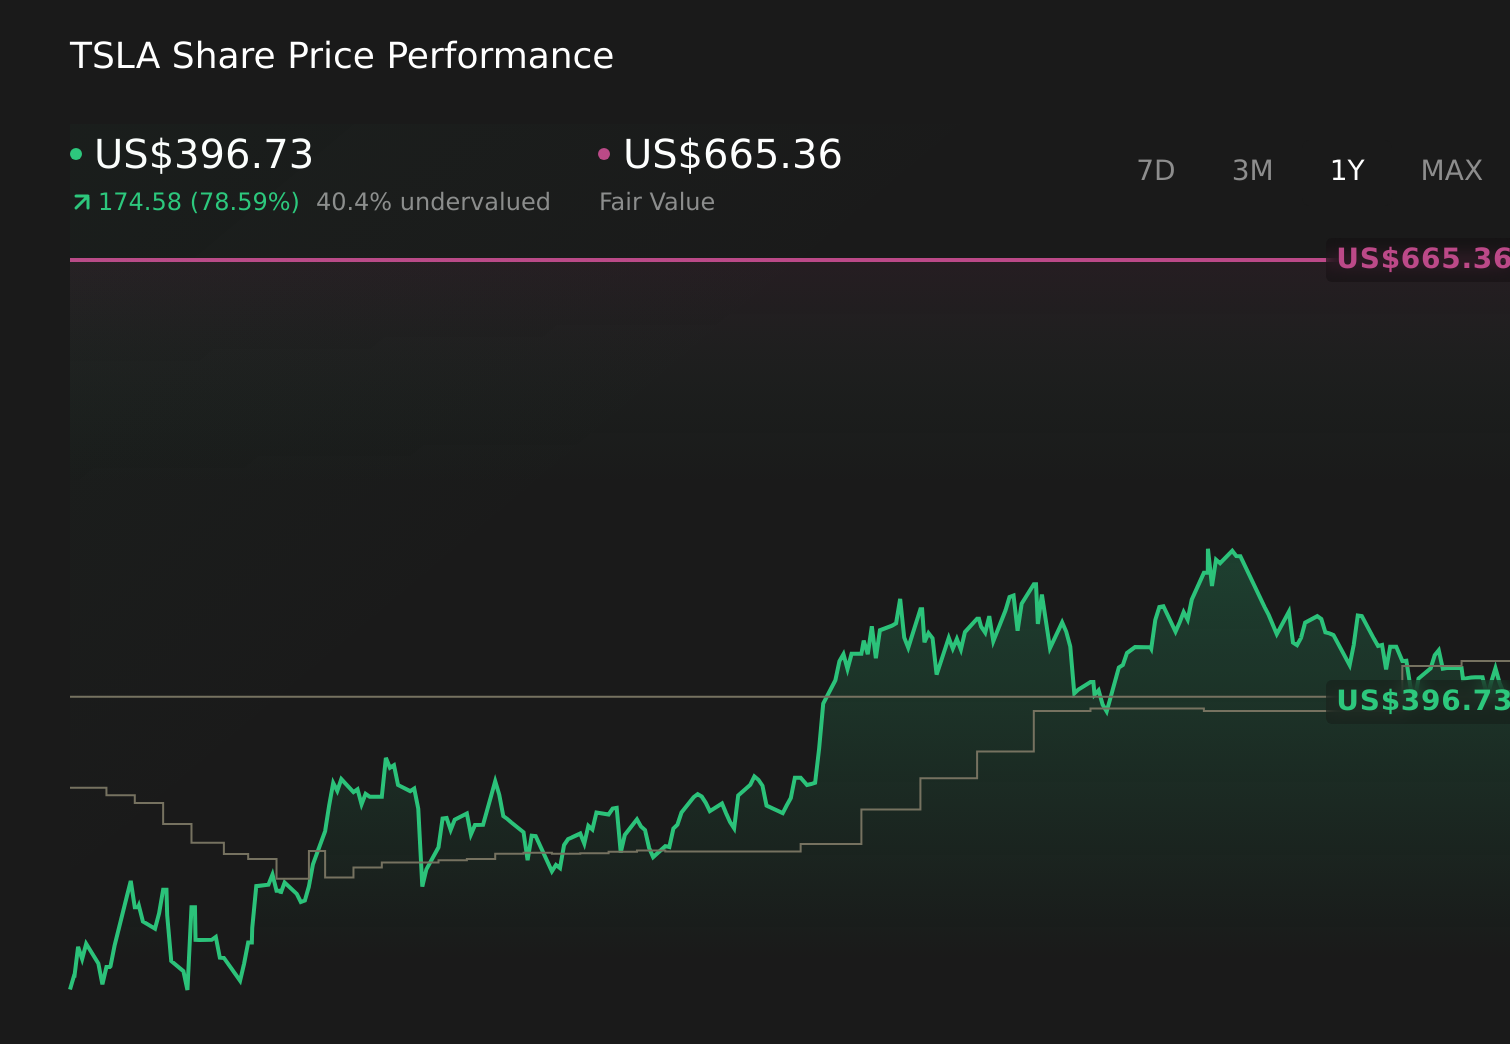 NasdaqGS:TSLA 1-Year Stock Price Chart
This article by Simply Wall St is general in nature. We provide commentary based on historical data
and analyst forecasts only using an unbiased methodology and our articles are not intended to be financial advice. It does not constitute a recommendation to buy or sell any stock, and does not take account of your objectives, or your
financial situation. We aim to bring you long-term focused analysis driven by fundamental data.
Note that our analysis may not factor in the latest price-sensitive company announcements or qualitative material.
Simply Wall St has no position in any stocks mentioned.
Valuation is complex, but we’re here to simplify it.
Discover if Tesla might be undervalued or overvalued with our detailed analysis, featuring fair value estimates, potential risks, dividends, insider trades, and its financial condition.
Have feedback on this article? Concerned about the content? Get in touch with us directly. Alternatively, email editorial-team@simplywallst.com


