

Feb 27, 2026
IndexBox has just published a new report: World – Motorcycles and Scooters – Market Analysis, Forecast, Size, Trends And Insights.
The article provides a comprehensive analysis of the global motorcycle and scooter market in 2024, highlighting a significant one-year decline in consumption and market value after a period of growth. It details the Philippines as the dominant consumer and importer, while China leads in production and exports. The market is forecast to grow slowly in volume (CAGR +0.9%) but more robustly in value (CAGR +1.9%) through 2035. The report breaks down trade flows by country and product type, noting stark differences in import/export prices and the strong performance of mid-range engine capacity segments.
Key Findings
The Philippines is the world’s largest consumer and importer, accounting for 46% of global volume and driving import growth with a +76.5% CAGRChina is the leading producer and exporter, manufacturing 51% of global output and holding a 28% share of export valueGlobal market volume and value saw sharp one-year declines in 2024 (-37.7% and -44.2% respectively) after a three-year growth periodForecast predicts a decelerating but positive trend to 2035, with volume CAGR of +0.9% and a stronger value CAGR of +1.9%Trade dynamics show a high-volume, low-price import flow to the Philippines versus high-value imports by the US and high-value exports from Italy and JapanMarket Forecast
Driven by increasing demand for motorcycles and scooters worldwide, the market is expected to continue an upward consumption trend over the next decade. Market performance is forecast to decelerate, expanding with an anticipated CAGR of +0.9% for the period from 2024 to 2035, which is projected to bring the market volume to 43M units by the end of 2035.
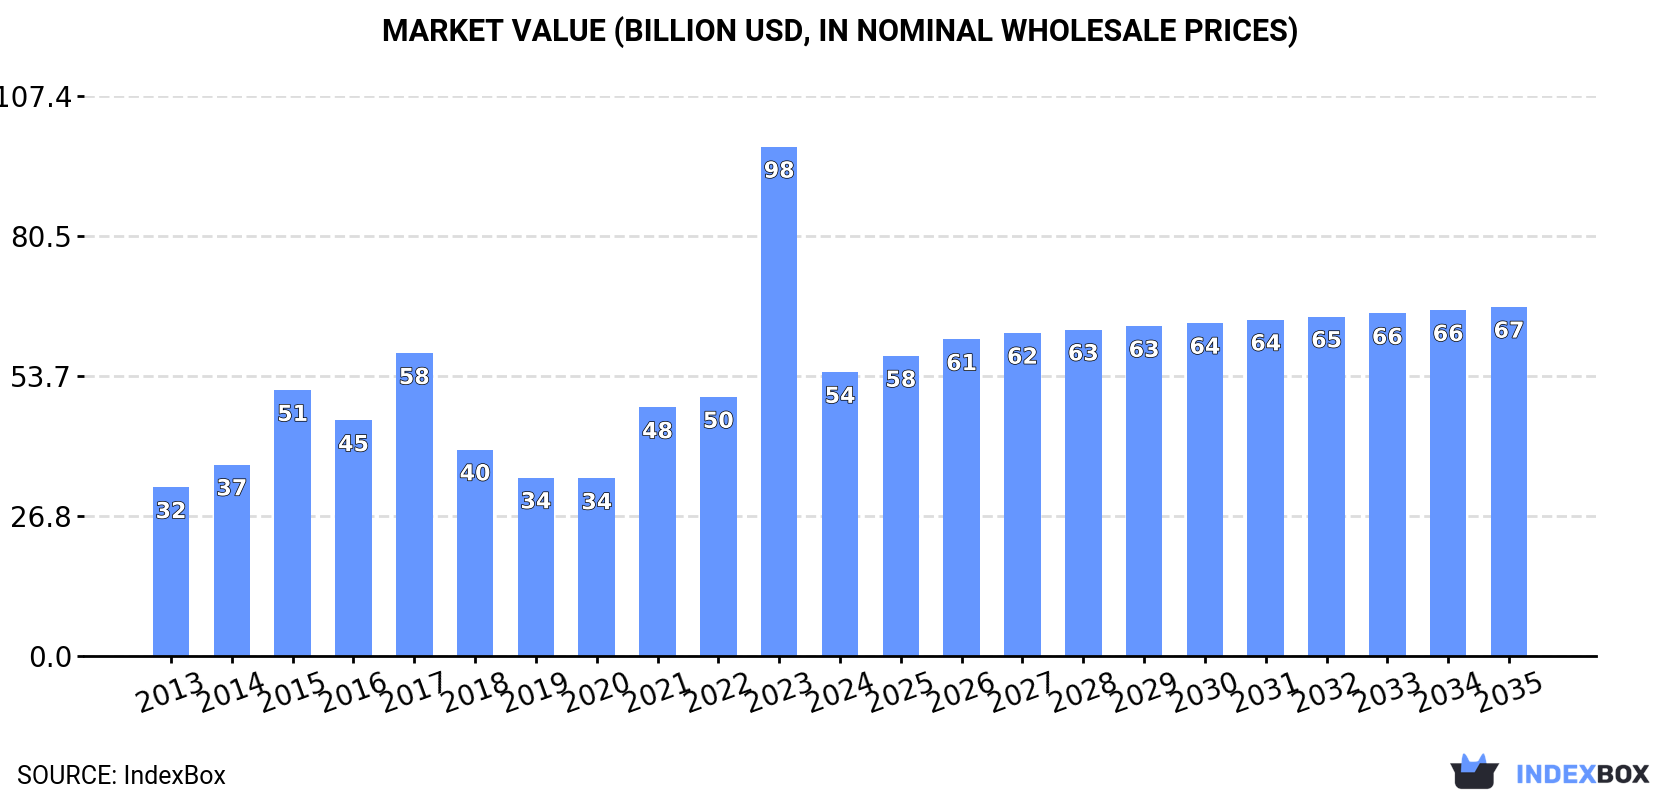
In value terms, the market is forecast to increase with an anticipated CAGR of +1.9% for the period from 2024 to 2035, which is projected to bring the market value to $66.9B (in nominal wholesale prices) by the end of 2035.
 ConsumptionWorld’s Consumption of Motorcycles and Scooters
After three years of growth, consumption of motorcycles and scooters decreased by -37.7% to 39M units in 2024. In general, consumption, however, recorded a tangible expansion. As a result, consumption reached the peak volume of 63M units, and then declined remarkably in the following year.
The global motorcycle and scooter market size declined significantly to $54.4B in 2024, dropping by -44.2% against the previous year. This figure reflects the total revenues of producers and importers (excluding logistics costs, retail marketing costs, and retailers’ margins, which will be included in the final consumer price). Overall, consumption, however, recorded a temperate increase. As a result, consumption attained the peak level of $97.6B, and then fell dramatically in the following year.
Consumption By Country
The Philippines (18M units) constituted the country with the largest volume of motorcycle and scooter consumption, comprising approx. 46% of total volume. Moreover, motorcycle and scooter consumption in the Philippines exceeded the figures recorded by the second-largest consumer, China (3.9M units), fivefold. The third position in this ranking was held by the United States (1.8M units), with a 4.6% share.
In the Philippines, motorcycle and scooter consumption expanded at an average annual rate of +51.9% over the period from 2013-2024. The remaining consuming countries recorded the following average annual rates of consumption growth: China (+1.6% per year) and the United States (+0.9% per year).
In value terms, the Philippines ($24.4B) led the market, alone. The second position in the ranking was taken by China ($5.3B). It was followed by the United States.
In the Philippines, the motorcycle and scooter market expanded at an average annual rate of +52.7% over the period from 2013-2024. The remaining consuming countries recorded the following average annual rates of market growth: China (+2.1% per year) and the United States (+1.4% per year).
In 2024, the highest levels of motorcycle and scooter per capita consumption was registered in the Philippines (155 units per 1000 persons), followed by Belgium (62 units per 1000 persons), Germany (7.7 units per 1000 persons) and Japan (5.6 units per 1000 persons), while the world average per capita consumption of motorcycle and scooter was estimated at 4.8 units per 1000 persons.
From 2013 to 2024, the average annual growth rate of the motorcycle and scooter per capita consumption in the Philippines stood at +49.8%. The remaining consuming countries recorded the following average annual rates of per capita consumption growth: Belgium (+22.9% per year) and Germany (+2.2% per year).
ProductionWorld’s Production of Motorcycles and Scooters
In 2024, production of motorcycles and scooters increased by 14% to 33M units, rising for the fourth consecutive year after two years of decline. In general, the total production indicated tangible growth from 2013 to 2024: its volume increased at an average annual rate of +3.2% over the last eleven-year period. The trend pattern, however, indicated some noticeable fluctuations being recorded throughout the analyzed period. Based on 2024 figures, production increased by +37.2% against 2020 indices. The most prominent rate of growth was recorded in 2018 when the production volume increased by 37% against the previous year. Global production peaked in 2024 and is likely to continue growth in years to come.
In value terms, motorcycle and scooter production rose modestly to $70.1B in 2024 estimated in export price. The total output value increased at an average annual rate of +3.0% from 2013 to 2024; however, the trend pattern indicated some noticeable fluctuations being recorded in certain years. The pace of growth appeared the most rapid in 2021 with an increase of 11% against the previous year. Global production peaked in 2024 and is likely to continue growth in the near future.
Production By Country
China (17M units) constituted the country with the largest volume of motorcycle and scooter production, accounting for 51% of total volume. Moreover, motorcycle and scooter production in China exceeded the figures recorded by the second-largest producer, India (5.1M units), threefold. The third position in this ranking was held by Indonesia (1.8M units), with a 5.5% share.
From 2013 to 2024, the average annual rate of growth in terms of volume in China amounted to +3.1%. In the other countries, the average annual rates were as follows: India (+3.4% per year) and Indonesia (+14.4% per year).
ImportsWorld’s Imports of Motorcycles and Scooters
In 2024, the amount of motorcycles and scooters imported worldwide contracted significantly to 27M units, with a decrease of -48.5% compared with the previous year. In general, imports, however, saw buoyant growth. The pace of growth appeared the most rapid in 2023 when imports increased by 135%. As a result, imports attained the peak of 52M units, and then declined markedly in the following year.
In value terms, motorcycle and scooter imports fell to $22.1B in 2024. Overall, total imports indicated pronounced growth from 2013 to 2024: its value increased at an average annual rate of +2.6% over the last eleven-year period. The trend pattern, however, indicated some noticeable fluctuations being recorded throughout the analyzed period. Based on 2024 figures, imports decreased by -11.8% against 2022 indices. The pace of growth was the most pronounced in 2021 with an increase of 27%. Global imports peaked at $25.1B in 2022; however, from 2023 to 2024, imports remained at a lower figure.
Imports By Country
The Philippines prevails in imports structure, amounting to 18M units, which was approx. 67% of total imports in 2024. Belgium (797K units), the United States (589K units), Mexico (513K units) and Argentina (459K units) held a minor share of total imports.
The Philippines was also the fastest-growing in terms of the motorcycles and scooters imports, with a CAGR of +76.5% from 2013 to 2024. At the same time, Belgium (+27.6%), Mexico (+9.6%) and the United States (+3.5%) displayed positive paces of growth. By contrast, Argentina (-2.2%) illustrated a downward trend over the same period. The Philippines (+66 p.p.) and Belgium (+2.6 p.p.) significantly strengthened its position in terms of the global imports, while Argentina saw its share reduced by -2.2% from 2013 to 2024, respectively. The shares of the other countries remained relatively stable throughout the analyzed period.
In value terms, the United States ($2.7B) constitutes the largest market for imported motorcycles and scooters worldwide, comprising 12% of global imports. The second position in the ranking was held by the Philippines ($1.1B), with a 5.2% share of global imports. It was followed by Belgium, with a 3.5% share.
In the United States, motorcycle and scooter imports expanded at an average annual rate of +2.2% over the period from 2013-2024. In the other countries, the average annual rates were as follows: the Philippines (+30.8% per year) and Belgium (+8.5% per year).
Imports By Type
Motorcycles (including mopeds) and cycles; fitted with an auxiliary motor, reciprocating internal combustion piston engine, of cylinder capacity exceeding 50cc but not exceeding 250cc, with or without side-cars; side-cars prevails in imports structure, recording 24M units, which was near 90% of total imports in 2024. Motorcycles (including mopeds) and cycles; fitted with auxiliary motor, reciprocating internal combustion piston engine of cylinder capacity exceeding 500cc but not exceeding 800cc, with or without sidecars; side-cars (1,208K units), motorcycles (including mopeds) and cycles; fitted with an auxiliary motor, reciprocating internal combustion piston engine, of cylinder capacity exceeding 250cc but not exceeding 500cc, with or without side-cars; side-cars (884K units) and motorcycles (including mopeds) and cycles; fitted with auxiliary motor, with reciprocating internal combustion piston engine of a cylinder capacity exceeding 800cc, with or without side-cars; side-cars (674K units) held a minor share of total imports.
Imports of motorcycles (including mopeds) and cycles; fitted with an auxiliary motor, reciprocating internal combustion piston engine, of cylinder capacity exceeding 50cc but not exceeding 250cc, with or without side-cars; side-cars increased at an average annual rate of +5.2% from 2013 to 2024. At the same time, motorcycles (including mopeds) and cycles; fitted with auxiliary motor, reciprocating internal combustion piston engine of cylinder capacity exceeding 500cc but not exceeding 800cc, with or without sidecars; side-cars (+11.8%), motorcycles (including mopeds) and cycles; fitted with an auxiliary motor, reciprocating internal combustion piston engine, of cylinder capacity exceeding 250cc but not exceeding 500cc, with or without side-cars; side-cars (+11.1%) and motorcycles (including mopeds) and cycles; fitted with auxiliary motor, with reciprocating internal combustion piston engine of a cylinder capacity exceeding 800cc, with or without side-cars; side-cars (+3.1%) displayed positive paces of growth. Moreover, motorcycles (including mopeds) and cycles; fitted with auxiliary motor, reciprocating internal combustion piston engine of cylinder capacity exceeding 500cc but not exceeding 800cc, with or without sidecars; side-cars emerged as the fastest-growing type imported in the world, with a CAGR of +11.8% from 2013-2024. From 2013 to 2024, the share of motorcycles (including mopeds) and cycles; fitted with auxiliary motor, reciprocating internal combustion piston engine of cylinder capacity exceeding 500cc but not exceeding 800cc, with or without sidecars; side-cars increased by +2.1 percentage points. The shares of the other products remained relatively stable throughout the analyzed period.
In value terms, motorcycles (including mopeds) and cycles; fitted with an auxiliary motor, reciprocating internal combustion piston engine, of cylinder capacity exceeding 50cc but not exceeding 250cc, with or without side-cars; side-cars ($8.3B), motorcycles (including mopeds) and cycles; fitted with auxiliary motor, with reciprocating internal combustion piston engine of a cylinder capacity exceeding 800cc, with or without side-cars; side-cars ($7.2B) and motorcycles (including mopeds) and cycles; fitted with auxiliary motor, reciprocating internal combustion piston engine of cylinder capacity exceeding 500cc but not exceeding 800cc, with or without sidecars; side-cars ($3.3B) appeared to be the products with the highest levels of imports in 2024, together accounting for 85% of global imports. These products were followed by motorcycles (including mopeds) and cycles; fitted with an auxiliary motor, reciprocating internal combustion piston engine, of cylinder capacity exceeding 250cc but not exceeding 500cc, with or without side-cars; side-cars, which accounted for a further 15%.
In terms of the main imported products, motorcycles (including mopeds) and cycles; fitted with an auxiliary motor, reciprocating internal combustion piston engine, of cylinder capacity exceeding 250cc but not exceeding 500cc, with or without side-cars; side-cars, with a CAGR of +9.4%, recorded the highest growth rate of the value of imports, over the period under review, while purchases for the other products experienced more modest paces of growth.
Import Prices By Type
In 2024, the average motorcycle and scooter import price amounted to $821 per unit, surging by 72% against the previous year. Over the period under review, the import price, however, recorded a pronounced setback. Global import price peaked at $1.3 thousand per unit in 2020; however, from 2021 to 2024, import prices remained at a lower figure.
Prices varied noticeably by the product type; the product with the highest price was motorcycles (including mopeds) and cycles; fitted with auxiliary motor, with reciprocating internal combustion piston engine of a cylinder capacity exceeding 800cc, with or without side-cars; side-cars ($11 thousand per unit), while the price for motorcycles (including mopeds) and cycles; fitted with an auxiliary motor, reciprocating internal combustion piston engine, of cylinder capacity exceeding 50cc but not exceeding 250cc, with or without side-cars; side-cars ($344 per unit) was amongst the lowest.
From 2013 to 2024, the most notable rate of growth in terms of prices was attained by motorcycles (including mopeds) and cycles; fitted with auxiliary motor, with reciprocating internal combustion piston engine of a cylinder capacity exceeding 800cc, with or without side-cars; side-cars (+0.0%), while the other products experienced a decline in the import price figures.
Import Prices By Country
In 2024, the average motorcycle and scooter import price amounted to $821 per unit, picking up by 72% against the previous year. In general, the import price, however, recorded a pronounced decline. Global import price peaked at $1.3 thousand per unit in 2020; however, from 2021 to 2024, import prices stood at a somewhat lower figure.
Prices varied noticeably by country of destination: amid the top importers, the country with the highest price was the United States ($4.5 thousand per unit), while the Philippines ($64 per unit) was amongst the lowest.
From 2013 to 2024, the most notable rate of growth in terms of prices was attained by Argentina (+0.7%), while the other global leaders experienced a decline in the import price figures.
ExportsWorld’s Exports of Motorcycles and Scooters
In 2024, global exports of motorcycles and scooters expanded sharply to 21M units, surging by 13% on the year before. Overall, exports enjoyed a perceptible increase. The pace of growth was the most pronounced in 2018 when exports increased by 83% against the previous year. The global exports peaked in 2024 and are expected to retain growth in the near future.
In value terms, motorcycle and scooter exports contracted slightly to $28.5B in 2024. In general, total exports indicated a pronounced increase from 2013 to 2024: its value increased at an average annual rate of +4.4% over the last eleven years. The trend pattern, however, indicated some noticeable fluctuations being recorded throughout the analyzed period. Based on 2024 figures, exports increased by +43.7% against 2020 indices. The growth pace was the most rapid in 2021 with an increase of 33% against the previous year. Over the period under review, the global exports attained the maximum at $28.6B in 2023, and then declined slightly in the following year.
Exports By Country
In 2024, China (13M units) represented the major exporter of motorcycles and scooters, achieving 62% of total exports. India (3.5M units) took a 17% share (based on physical terms) of total exports, which put it in second place, followed by Indonesia (5.6%). Thailand (664K units), Vietnam (563K units), Japan (557K units) and Italy (341K units) followed a long way behind the leaders.
Exports from China increased at an average annual rate of +3.7% from 2013 to 2024. At the same time, Indonesia (+27.5%), Vietnam (+7.3%), Italy (+5.6%), India (+4.1%) and Thailand (+2.8%) displayed positive paces of growth. Moreover, Indonesia emerged as the fastest-growing exporter exported in the world, with a CAGR of +27.5% from 2013-2024. Japan experienced a relatively flat trend pattern. While the share of Indonesia (+5 p.p.) increased significantly in terms of the global exports from 2013-2024, the share of China (-1.7 p.p.) displayed negative dynamics. The shares of the other countries remained relatively stable throughout the analyzed period.
In value terms, China ($8.1B) remains the largest motorcycle and scooter supplier worldwide, comprising 28% of global exports. The second position in the ranking was taken by Japan ($3.2B), with an 11% share of global exports. It was followed by India, with an 11% share.
In China, motorcycle and scooter exports increased at an average annual rate of +5.1% over the period from 2013-2024. In the other countries, the average annual rates were as follows: Japan (+1.5% per year) and India (+5.8% per year).
Exports By Type
Motorcycles (including mopeds) and cycles; fitted with an auxiliary motor, reciprocating internal combustion piston engine, of cylinder capacity exceeding 50cc but not exceeding 250cc, with or without side-cars; side-cars prevails in exports structure, finishing at 18M units, which was near 88% of total exports in 2024. It was distantly followed by motorcycles (including mopeds) and cycles; fitted with an auxiliary motor, reciprocating internal combustion piston engine, of cylinder capacity exceeding 250cc but not exceeding 500cc, with or without side-cars; side-cars (1.3M units), comprising a 6.4% share of total exports. The following types – motorcycles (including mopeds) and cycles; fitted with auxiliary motor, with reciprocating internal combustion piston engine of a cylinder capacity exceeding 800cc, with or without side-cars; side-cars (647K units) and motorcycles (including mopeds) and cycles; fitted with auxiliary motor, reciprocating internal combustion piston engine of cylinder capacity exceeding 500cc but not exceeding 800cc, with or without sidecars; side-cars (564K units) – each reached a 5.8% share of total exports.
From 2013 to 2024, average annual rates of growth with regard to motorcycles (including mopeds) and cycles; fitted with an auxiliary motor, reciprocating internal combustion piston engine, of cylinder capacity exceeding 50cc but not exceeding 250cc, with or without side-cars; side-cars exports of stood at +3.5%. At the same time, motorcycles (including mopeds) and cycles; fitted with an auxiliary motor, reciprocating internal combustion piston engine, of cylinder capacity exceeding 250cc but not exceeding 500cc, with or without side-cars; side-cars (+14.5%), motorcycles (including mopeds) and cycles; fitted with auxiliary motor, reciprocating internal combustion piston engine of cylinder capacity exceeding 500cc but not exceeding 800cc, with or without sidecars; side-cars (+4.3%) and motorcycles (including mopeds) and cycles; fitted with auxiliary motor, with reciprocating internal combustion piston engine of a cylinder capacity exceeding 800cc, with or without side-cars; side-cars (+2.9%) displayed positive paces of growth. Moreover, motorcycles (including mopeds) and cycles; fitted with an auxiliary motor, reciprocating internal combustion piston engine, of cylinder capacity exceeding 250cc but not exceeding 500cc, with or without side-cars; side-cars emerged as the fastest-growing type exported in the world, with a CAGR of +14.5% from 2013-2024. While the share of motorcycles (including mopeds) and cycles; fitted with an auxiliary motor, reciprocating internal combustion piston engine, of cylinder capacity exceeding 250cc but not exceeding 500cc, with or without side-cars; side-cars (+4.2 p.p.) increased significantly in terms of the global exports from 2013-2024, the share of motorcycles (including mopeds) and cycles; fitted with an auxiliary motor, reciprocating internal combustion piston engine, of cylinder capacity exceeding 50cc but not exceeding 250cc, with or without side-cars; side-cars (-3.9 p.p.) displayed negative dynamics. The shares of the other products remained relatively stable throughout the analyzed period.
In value terms, motorcycles (including mopeds) and cycles; fitted with an auxiliary motor, reciprocating internal combustion piston engine, of cylinder capacity exceeding 50cc but not exceeding 250cc, with or without side-cars; side-cars ($14B), motorcycles (including mopeds) and cycles; fitted with auxiliary motor, with reciprocating internal combustion piston engine of a cylinder capacity exceeding 800cc, with or without side-cars; side-cars ($7.3B) and motorcycles (including mopeds) and cycles; fitted with an auxiliary motor, reciprocating internal combustion piston engine, of cylinder capacity exceeding 250cc but not exceeding 500cc, with or without side-cars; side-cars ($3.8B) were the products with the highest levels of exports in 2024, together accounting for 88% of global exports.
In terms of the main exported products, motorcycles (including mopeds) and cycles; fitted with an auxiliary motor, reciprocating internal combustion piston engine, of cylinder capacity exceeding 250cc but not exceeding 500cc, with or without side-cars; side-cars, with a CAGR of +10.4%, recorded the highest growth rate of the value of exports, over the period under review, while shipments for the other products experienced more modest paces of growth.
Export Prices By Type
The average motorcycle and scooter export price stood at $1.4 thousand per unit in 2024, dropping by -11.5% against the previous year. Overall, the export price, however, saw a relatively flat trend pattern. The pace of growth was the most pronounced in 2015 when the average export price increased by 64%. Over the period under review, the average export prices attained the maximum at $2.3 thousand per unit in 2017; however, from 2018 to 2024, the export prices stood at a somewhat lower figure.
There were significant differences in the average prices amongst the major exported products. In 2024, the product with the highest price was motorcycles (including mopeds) and cycles; fitted with auxiliary motor, with reciprocating internal combustion piston engine of a cylinder capacity exceeding 800cc, with or without side-cars; side-cars ($11 thousand per unit), while the average price for exports of motorcycles (including mopeds) and cycles; fitted with an auxiliary motor, reciprocating internal combustion piston engine, of cylinder capacity exceeding 50cc but not exceeding 250cc, with or without side-cars; side-cars ($763 per unit) was amongst the lowest.
From 2013 to 2024, the most notable rate of growth in terms of prices was attained by motorcycles (including mopeds) and cycles; fitted with auxiliary motor, with reciprocating internal combustion piston engine of a cylinder capacity exceeding 800cc, with or without side-cars; side-cars (+1.1%), while the other products experienced mixed trends in the export price figures.
Export Prices By Country
The average motorcycle and scooter export price stood at $1.4 thousand per unit in 2024, reducing by -11.5% against the previous year. Overall, the export price, however, saw a relatively flat trend pattern. The most prominent rate of growth was recorded in 2015 an increase of 64% against the previous year. The global export price peaked at $2.3 thousand per unit in 2017; however, from 2018 to 2024, the export prices stood at a somewhat lower figure.
There were significant differences in the average prices amongst the major exporting countries. In 2024, amid the top suppliers, the country with the highest price was Italy ($6.3 thousand per unit), while China ($625 per unit) was amongst the lowest.
From 2013 to 2024, the most notable rate of growth in terms of prices was attained by Thailand (+2.7%), while the other global leaders experienced more modest paces of growth.
Source: IndexBox Market Intelligence Platform
This report provides a comprehensive view of the global motorcycle and scooter industry, tracking demand, supply, and trade flows across the worldwide value chain. It explains how demand across key channels and end-use segments shapes consumption patterns, while also mapping the role of input availability, production efficiency, and regulatory standards on supply.
Beyond headline metrics, the study benchmarks prices, margins, and trade routes so you can see where value is created and how it moves between exporters and importers worldwide. The analysis is designed to support strategic planning, market entry, portfolio prioritization, and risk management in the global motorcycle and scooter landscape.
Quick navigation
Key findings
Global demand is shaped by both household and industrial usage, with trade flows linking cost-competitive producers to import-reliant markets.
Pricing dynamics reflect unit values, freight costs, exchange rates, and regulatory shifts that affect sourcing decisions.
Supply depends on input availability and production efficiency, creating distinct cost curves across regions.
Market concentration varies by country, creating different competitive landscapes and entry barriers.
The 2035 outlook highlights where capacity investment and demand growth are most aligned globally.
Report scope
The report combines market sizing with trade intelligence and price analytics. It covers both historical performance and the forward outlook to 2035, allowing you to compare cycles, structural shifts, and policy impacts across countries and regions.
Market size and growth in value and volume terms
Consumption structure by end-use segments and regions
Production capacity, output, and cost dynamics
Global trade flows, exporters, importers, and balances
Price benchmarks, unit values, and margin signals
Competitive context and market entry conditions
Product coverageProdcom 30911200 – Motorcycles with reciprocating internal combustion piston engine > .50 cm.Country coverageCountry profiles and benchmarks
For the global report, country profiles provide a consistent view of market size, trade balance, prices, and per-capita indicators. The profiles highlight the largest consuming and producing markets and allow direct benchmarking across peers.
Methodology
The analysis is built on a multi-source framework that combines official statistics, trade records, company disclosures, and expert validation. Data are standardized, reconciled, and cross-checked to ensure consistency across time series.
International trade data (exports, imports, and mirror statistics)
National production and consumption statistics
Company-level information from financial filings and public releases
Price series and unit value benchmarks
Analyst review, outlier checks, and time-series validation
All data are normalized to a common product definition and mapped to a consistent set of codes. This ensures that comparisons across time are aligned and actionable.
Forecasts to 2035
The forecast horizon extends to 2035 and is based on a structured model that links motorcycle and scooter demand and supply to macroeconomic indicators, trade patterns, and sector-specific drivers. The model captures both cyclical and structural factors and reflects known policy and technology shifts.
Historical baseline: 2012-2025
Forecast horizon: 2026-2035
Scenario-based sensitivity to income growth, substitution, and regulation
Capacity and investment outlook for major producing countries
Each country projection is built from its own historical pattern and the regional context, allowing the report to show where growth is concentrated and where risks are elevated.
Price analysis and trade dynamics
Prices are analyzed in detail, including export and import unit values, regional spreads, and changes in trade costs. The report highlights how seasonality, freight rates, exchange rates, and supply disruptions influence pricing and margins.
Price benchmarks by country and sub-region
Export and import unit value trends
Seasonality and calendar effects in trade flows
Price outlook to 2035 under baseline assumptions
Profiles of market participants
Key producers, exporters, and distributors are profiled with a focus on their operational scale, geographic footprint, product mix, and market positioning. This helps identify competitive pressure points, partnership opportunities, and routes to differentiation.
Business focus and production capabilities
Geographic reach and distribution networks
Cost structure and pricing strategy indicators
Compliance, certification, and sustainability context
How to use this report
Quantify global demand and identify the most attractive markets
Evaluate export opportunities and prioritize target countries
Track price dynamics and protect margins
Benchmark performance against major competitors
Build evidence-based forecasts for investment decisions
This report is designed for manufacturers, distributors, importers, wholesalers, investors, and advisors who need a clear, data-driven picture of global motorcycle and scooter dynamics.
FAQ
What is included in the global motorcycle and scooter market?
The market size aggregates consumption and trade data at country and regional levels, presented in both value and volume terms.
How are the forecasts to 2035 built?
The projections combine historical trends with macroeconomic indicators, trade dynamics, and sector-specific drivers.
Does the report cover prices and margins?
Yes, it includes export and import unit values, regional spreads, and a pricing outlook to 2035.
Which countries are profiled in detail?
The report provides profiles for the largest consuming and producing countries, enabling benchmarking across peers.
Can this report support market entry decisions?
Yes, it highlights demand hotspots, trade routes, pricing trends, and competitive context.