
 Share Price Reflect Its Role In The Electric Vehicle Shift?")
Track your investments for FREE with Simply Wall St, the portfolio command center trusted by over 7 million individual investors worldwide.
If you are wondering whether Tesla’s share price matches what you are actually getting as an investor, you are not alone. That question is exactly what this review will focus on.
Tesla’s stock recently closed at US$406.01, with returns of a 5.9% decline over 7 days, a 10.1% decline over 30 days, a 7.3% decline year to date and a 7.4% gain over the last year, alongside a 101.7% return over 3 years and 51.3% over 5 years. These figures can signal changing views on both its potential and its risks.
Recent headlines have continued to focus heavily on Tesla’s role in the global electric vehicle shift and the market’s reaction to its position in that space. This backdrop helps frame why the share price can move sharply in short periods as investors reassess how much they are willing to pay for that story.
On Simply Wall St’s 6 point valuation checklist, Tesla scores 0 out of 6. The rest of this article will walk through what different valuation methods say about that score, before finishing with a more holistic way to think about Tesla’s value.
Tesla scores just 0/6 on our valuation checks. See what other red flags we found in the full valuation breakdown.
A Discounted Cash Flow, or DCF, model estimates what a company could be worth by projecting its future cash flows and then discounting those back to today to reflect risk and the time value of money.
For Tesla, the model used is a 2 Stage Free Cash Flow to Equity approach based on cash flow projections. The latest twelve month free cash flow is about US$5.3b. Analyst estimates and extrapolated figures suggest free cash flow moving to US$24.9b by 2030, with annual projections in between that include both positive and negative years. Simply Wall St uses analyst inputs for the earlier years, then extends that pattern further out to build a ten year path in US$.
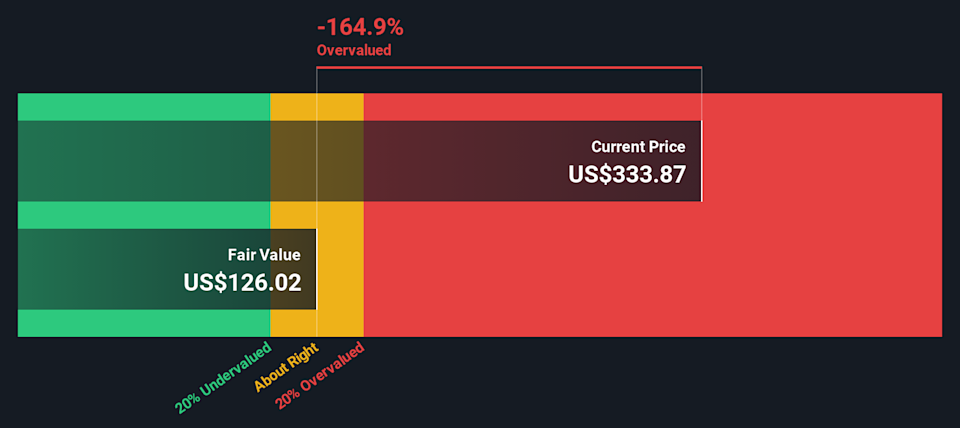
When all of those projected cash flows are discounted back, the resulting intrinsic value comes out at US$126.14 per share. Compared to the recent share price of US$406.01, the DCF output points to the stock trading at a premium, with an implied overvaluation of 221.9%.
Result: OVERVALUED
Our Discounted Cash Flow (DCF) analysis suggests Tesla may be overvalued by 221.9%. Discover 868 undervalued stocks or create your own screener to find better value opportunities.
 TSLA Discounted Cash Flow as at Feb 2026
Story Continues
For a company like Tesla that is already generating substantial revenue, the P/S ratio is a useful way to relate what you pay per share to the sales the business produces. It sidesteps some of the noise that can sit in earnings and focuses on how the market prices each dollar of revenue.
Investors usually expect higher P/S ratios where they see stronger growth potential or lower perceived risk, and lower P/S ratios where growth looks more modest or risks feel higher. So the question is not whether a high or low multiple is good, but whether it lines up with the company’s profile.
Tesla currently trades on a P/S of 16.07x. That sits well above the Auto industry average of 0.69x and the peer group average of 1.20x. Simply Wall St’s Fair Ratio for Tesla is 3.40x. This Fair Ratio is a proprietary estimate of what the P/S could be given factors like earnings growth, industry, profit margin, market cap and risk. It usually gives a more tailored view than a simple comparison against peers or the broad industry.
Compared with this 3.40x Fair Ratio, the current 16.07x P/S points to Tesla trading at a premium.
Result: OVERVALUED
 NasdaqGS:TSLA P/S Ratio as at Feb 2026
P/S ratios tell one story, but what if the real opportunity lies elsewhere? Discover 1426 companies where insiders are betting big on explosive growth.
Earlier we mentioned that there is an even better way to understand valuation, so let us introduce you to Narratives. These are simply your story about a company written into numbers such as fair value, and estimates for future revenue, earnings and margins.
A Narrative links what you believe about Tesla’s business to a financial forecast, and then to a fair value that you can compare directly with today’s share price to decide whether the stock looks attractive or expensive to you.
On Simply Wall St, Narratives sit inside the Community page and are used by millions of investors. This gives you an easy way to see how your view on Tesla’s growth, profitability and risk translates into a specific fair value that updates automatically when fresh news, earnings or other data arrive.
For example, one Tesla Narrative on the platform might assume a very optimistic future and arrive at a much higher fair value, while another far more cautious Narrative might use modest growth and margins to produce a much lower fair value. This shows you how different views can lead to very different price signals.
Do you think there’s more to the story for Tesla? Head over to our Community to see what others are saying!
NasdaqGS:TSLA 1-Year Stock Price Chart
This article by Simply Wall St is general in nature. We provide commentary based on historical data and analyst forecasts only using an unbiased methodology and our articles are not intended to be financial advice. It does not constitute a recommendation to buy or sell any stock, and does not take account of your objectives, or your financial situation. We aim to bring you long-term focused analysis driven by fundamental data. Note that our analysis may not factor in the latest price-sensitive company announcements or qualitative material. Simply Wall St has no position in any stocks mentioned.
Companies discussed in this article include TSLA.
Have feedback on this article? Concerned about the content? Get in touch with us directly. Alternatively, email editorial-team@simplywallst.com


