

We conducted a comparative attributional GHG LCA (carbon footprint) for all 459 light-duty vehicle models produced for sale in the US in 2023, including ICEVs, HEVs, PHEVs and BEVs. The study’s scope includes the materials, high-voltage traction battery, assembly & logistics, operation, and services & decommissioning (Fig. 6). The functional unit is one mile of vehicle travel. Impact assessment uses 100-year global warming potentials (GWPs), excluding biogenic carbon and including land use change from the IPCC’s Sixth Assessment Report31.
Fig. 6: Structure of the life cycle carbon footprint model.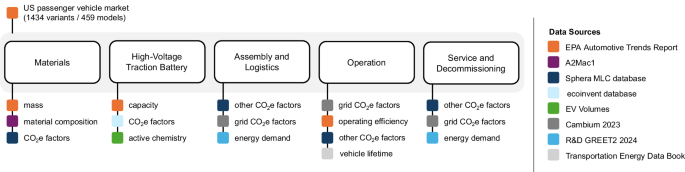
Key data sources and inputs used to model the 2023 US vehicle market carbon footprint3,21,25,26,32,35,36,37.
The model takes information on vehicles produced for sale in the US, along with information on their fuel efficiency, as reported by the 2024 EPA Automotive Trends Report (EPA ATR)3 to describe the LDV market in 2023. These data are then coupled with information from BOM data derived from vehicle teardowns and reference life cycle inventory data (Table S2) to determine the life cycle carbon footprint from 2023 vehicles. More information on the model, data, and methods is provided in Supplementary Methods.
Data for 2023 light-duty vehicles in the US
The EPA ATR covers model year 2023 light duty vehicles produced for sale in the US, including information for 1438 variants across 461 models and 48 brands. The data are sorted into five vehicle types: sedans, coupes, and wagons (sedans); small and/or two wheel-drive sport utility vehicles (small SUVs); large and/or all-wheel drive SUVs (large SUVs); pickups; and vans. The vehicles are also categorized into six powertrain categories: gasoline, diesel, hybrids, plug-in hybrids, battery electric vehicles, and fuel cell vehicles. Only four total variants (two models) of fuel cell vehicles were produced for sale in 2023 and are excluded from the scope of this study. This study combines gasoline and diesel powertrains into a single ICEV category. Table 1 shows the breakdown of variants.
Table 1 Vehicle variants by powertrain and segment reported in the EPA ATR
The EPA ATR data include many key characteristics of vehicles, including fuel efficiency, tailpipe emissions, weight class, size, battery capacity, battery energy density, production volumes, and more. Life cycle carbon footprints were generated for each of the 1434 variants in the vehicle set. Variants represent different homologated vehicles within a given make and model and may include different engine specifications, wheel configurations, battery sizes or other defining characteristics. Variants were grouped into their models based on their make, model, powertrain, and vehicle segment, creating the 459 individual vehicle models used in this study. Tables S3 and S4 in the supplemental information show the breakdown of vehicle models and the production volumes, respectively.
Materials
While materials such as steel, aluminum, polymers, and glass are found across all vehicles, the ratio of these materials—as well as more specific material specifications (e.g., polypropylene, cast aluminum)—need to be defined to assess the carbon footprint. Obtaining make and model-specific BOMs can provide detailed vehicle material composition data.
A2Mac1 is a vehicle benchmarking service that, amongst other offerings, conducts physical teardowns of vehicles and categorizes parts into material types25. Teardowns are available for many of the most common vehicles on the global market. This study pulled teardown data for 124 vehicles in the A2Mac1 database. These BOMs were parsed and organized using a custom script that categorized the end-item parts into 24 material types. This resulted in 124 unique vehicle material breakdowns.
Figure 7 shows the material summary in which the 24 material types are binned into four basic material categories: steel, polymers, aluminum, and other. Vehicles where A2Mac1 BOMs were not realized were modeled as containing the average material composition of their vehicle segment and powertrain, scaled by the vehicle variant’s mass. In general, BEVs contain lower fractions of steel (40% vs. 49%) and higher fractions of aluminum (16% vs. 11%) and polymers (35% vs. 25%) than non-BEVs.
Fig. 7: Material breakdown of 124 vehicles into steel, aluminum, polymers, and other materials using data from A2Mac1. On average, BEVs contain lower fractions of steel (40% vs. 49%) and higher fractions of aluminum (16% vs. 11%) and polymers (35% vs. 25%) than non-BEVs.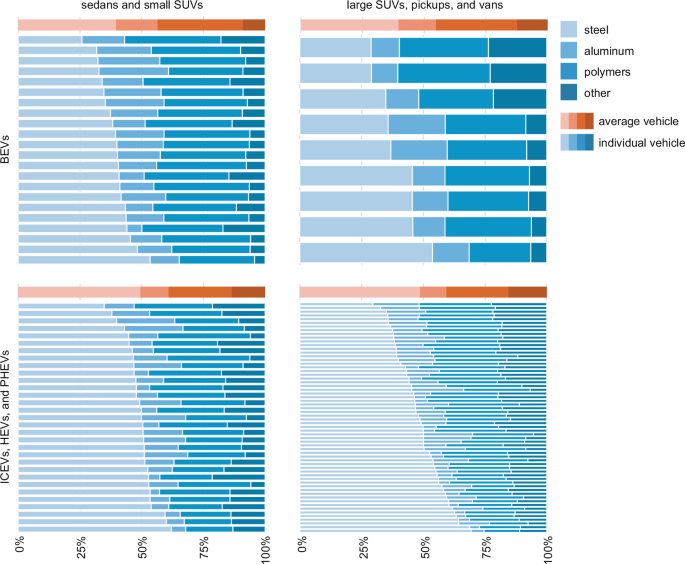
The full breakdown (not shown) includes distribution into 24 different material categories. This data excludes materials used in high-voltage traction battery cells.
Two important takeaways become apparent. First, every segment has considerable variation between individual vehicles. While the average is helpful for understanding reasonable material compositions, any given vehicle is likely to have very different ratios, and this should be considered when analyzing a prototypical vehicle. Second, vehicle lightweighting is evident in BEV material compositions, which typically use more polymers and aluminum than other powertrains. This will affect the carbon footprint of the materials for these powertrains.
High-voltage traction battery
The high-voltage traction battery is the energy storage system that provides power to the electric powertrains in HEVs, PHEVs, and BEVs. Battery capacity information (amp-hours and voltage) is available in the data from the EPA ATR. These batteries are all lithium-ion chemistries, differentiated by their cathode active materials.
Broadly speaking there are three dominant chemistries: nickel manganese cobalt (NMC) (differentiated by the ratios of N:M:C in the cathode), nickel cobalt aluminum (NCA); and lithium iron phosphate (LFP). Variant-specific battery chemistries for each vehicle are derived from EV Volumes, a database that tracks EV sales along with EV model and variant information32.
Cell-level energy densities for different battery chemistries are required to estimate the battery cell weight to separate the mass of battery cells from the curb weight of the vehicle. This is required because the BOMs do not distinguish battery cell mass from battery pack mass. Cell-level energy densities are derived from the BatPac V5.1 model33, and reference life cycle inventory datasets used to estimate the carbon footprints of battery production are described in Table S2 of the Supplementary Methods. More information on the model and data for the high-voltage traction battery is provided in the Supplementary Methods associated with this article.
Energy
For ICEVs and HEVs, fuel efficiency and tailpipe emissions during vehicle operation are available from the EPA ATR. The report approximates real-world energy and emissions by using an expanded 5-cycle testing regimen (including hot and cold weather, higher speeds, and faster accelerations) and weighted by a 43% / 57% split between city and highway driving. Emissions from upstream fuel production are captured using the fuel efficiency multiplied by reference life cycle inventory datasets for the production of gasoline or diesel.
For BEVs, electricity consumption, including charging losses, is gathered from the Trends data by converting the fuel efficiency equivalent (known as miles per gallon equivalent, MPGe) to electricity by dividing by the energy content of gasoline (33.7 kilowatt-hours per gallon)34. In addition to energy demand from operation, this study also accounts for non-operation energy demand, which accounts for energy losses while the vehicle is parked (often referred to as vampire or phantom drain). This energy is used to operate battery management units, security features, remote access, and other services. Conservatively, EVs are assumed to consume 500 watt-hours per day in non-operation energy.
PHEV energy consumption is split between fuel and electricity. This split is characterized by a utility factor, which is a projected percentage of time that PHEV is expected to operate using only electricity. Utility factors are available in the data for the Trends report and range from 22% to 92%, with an average of 51% of operation for PHEVs using electricity. The data for this report use utility factors that are specific to a given PHEV.
Electricity
The National Renewable Energy Laboratory’s (NREL) Cambium 2023 model is used for GHG factors of the US electricity grid. Cambium provides forecasts of the electricity grid through 2050 under multiple scenarios, which allows for the future grid to be assessed for PHEVs and EVs. The default scenario in this study uses average emission rates in the mid-case scenario. The first electricity data in the Cambium 2023 model is for calendar year 2025. To align with the vehicle model year (2023) used in this study, the Cambium data is projected backwards (linearly based on annual difference between 2025 and 2030 values) two years to match the beginning of the analysis period. Table S5 provides more information on the electricity emission rates.
Vehicle lifetime
Vehicle lifetime differs between cars and light trucks. The median lifetime for cars is 16 years and 181,870 miles; light trucks is 17 years and 213,661 miles28. Annual mileage decreases each year of ownership, starting with approximately 14,000-16,000 miles in the first year down to around 8000 miles in the last year. The annual mileage decrease is relevant for PHEV and BEV powertrains that rely on electricity mixes that change each year.
Scenario analysis
Seven scenarios were included to examine the influence of LCA assumption and parameters that are known to affect BEV performance or otherwise introduce variability in carbon footprint results. Electricity mixes are tested with a fossil-fuel-heavy state grid mix, using Kentucky as a representative mix, a renewable-heavy state grid mix based on Vermont, and by replacing average electricity mixes with long-run marginal electricity emissions from the Cambium model35. Next, a scenario that assumes that 25% of all BEV batteries require replacement during the vehicle lifetime is used to test the importance of battery production impacts. This scenario can also be interpreted as testing the influence of larger battery capacities or more carbon-intensive manufacturing since both situations could similarly affect the carbon footprint. Operating conditions are then tested using a cold-weather state, North Dakota, which has the largest temperature adjustment factor for BEVs (an 89% increase in energy consumption) based on Woody et al.’s12 analysis using monthly average temperature records and assuming a shorter operating life for all vehicles (10 years). Finally, a combined scenario is run that provides a potential worst-case scenario for BEVs operated in the US.
![Hyundai's biggest EV caught in action for the first time [Video]](https://www.evshift.com/wp-content/uploads/2026/01/1769810457_hyundai-electric-van-3-770x515.jpeg "Hyundai’s biggest EV caught in action for the first time [Video]")


