

One in three new vehicles sold in Colorado last quarter was electric. In Wyoming, fewer than 800 EVs exist statewide. Same country, same year, radically different realities. The American EV market fractured in 2025.
The federal tax credit died on September 30.
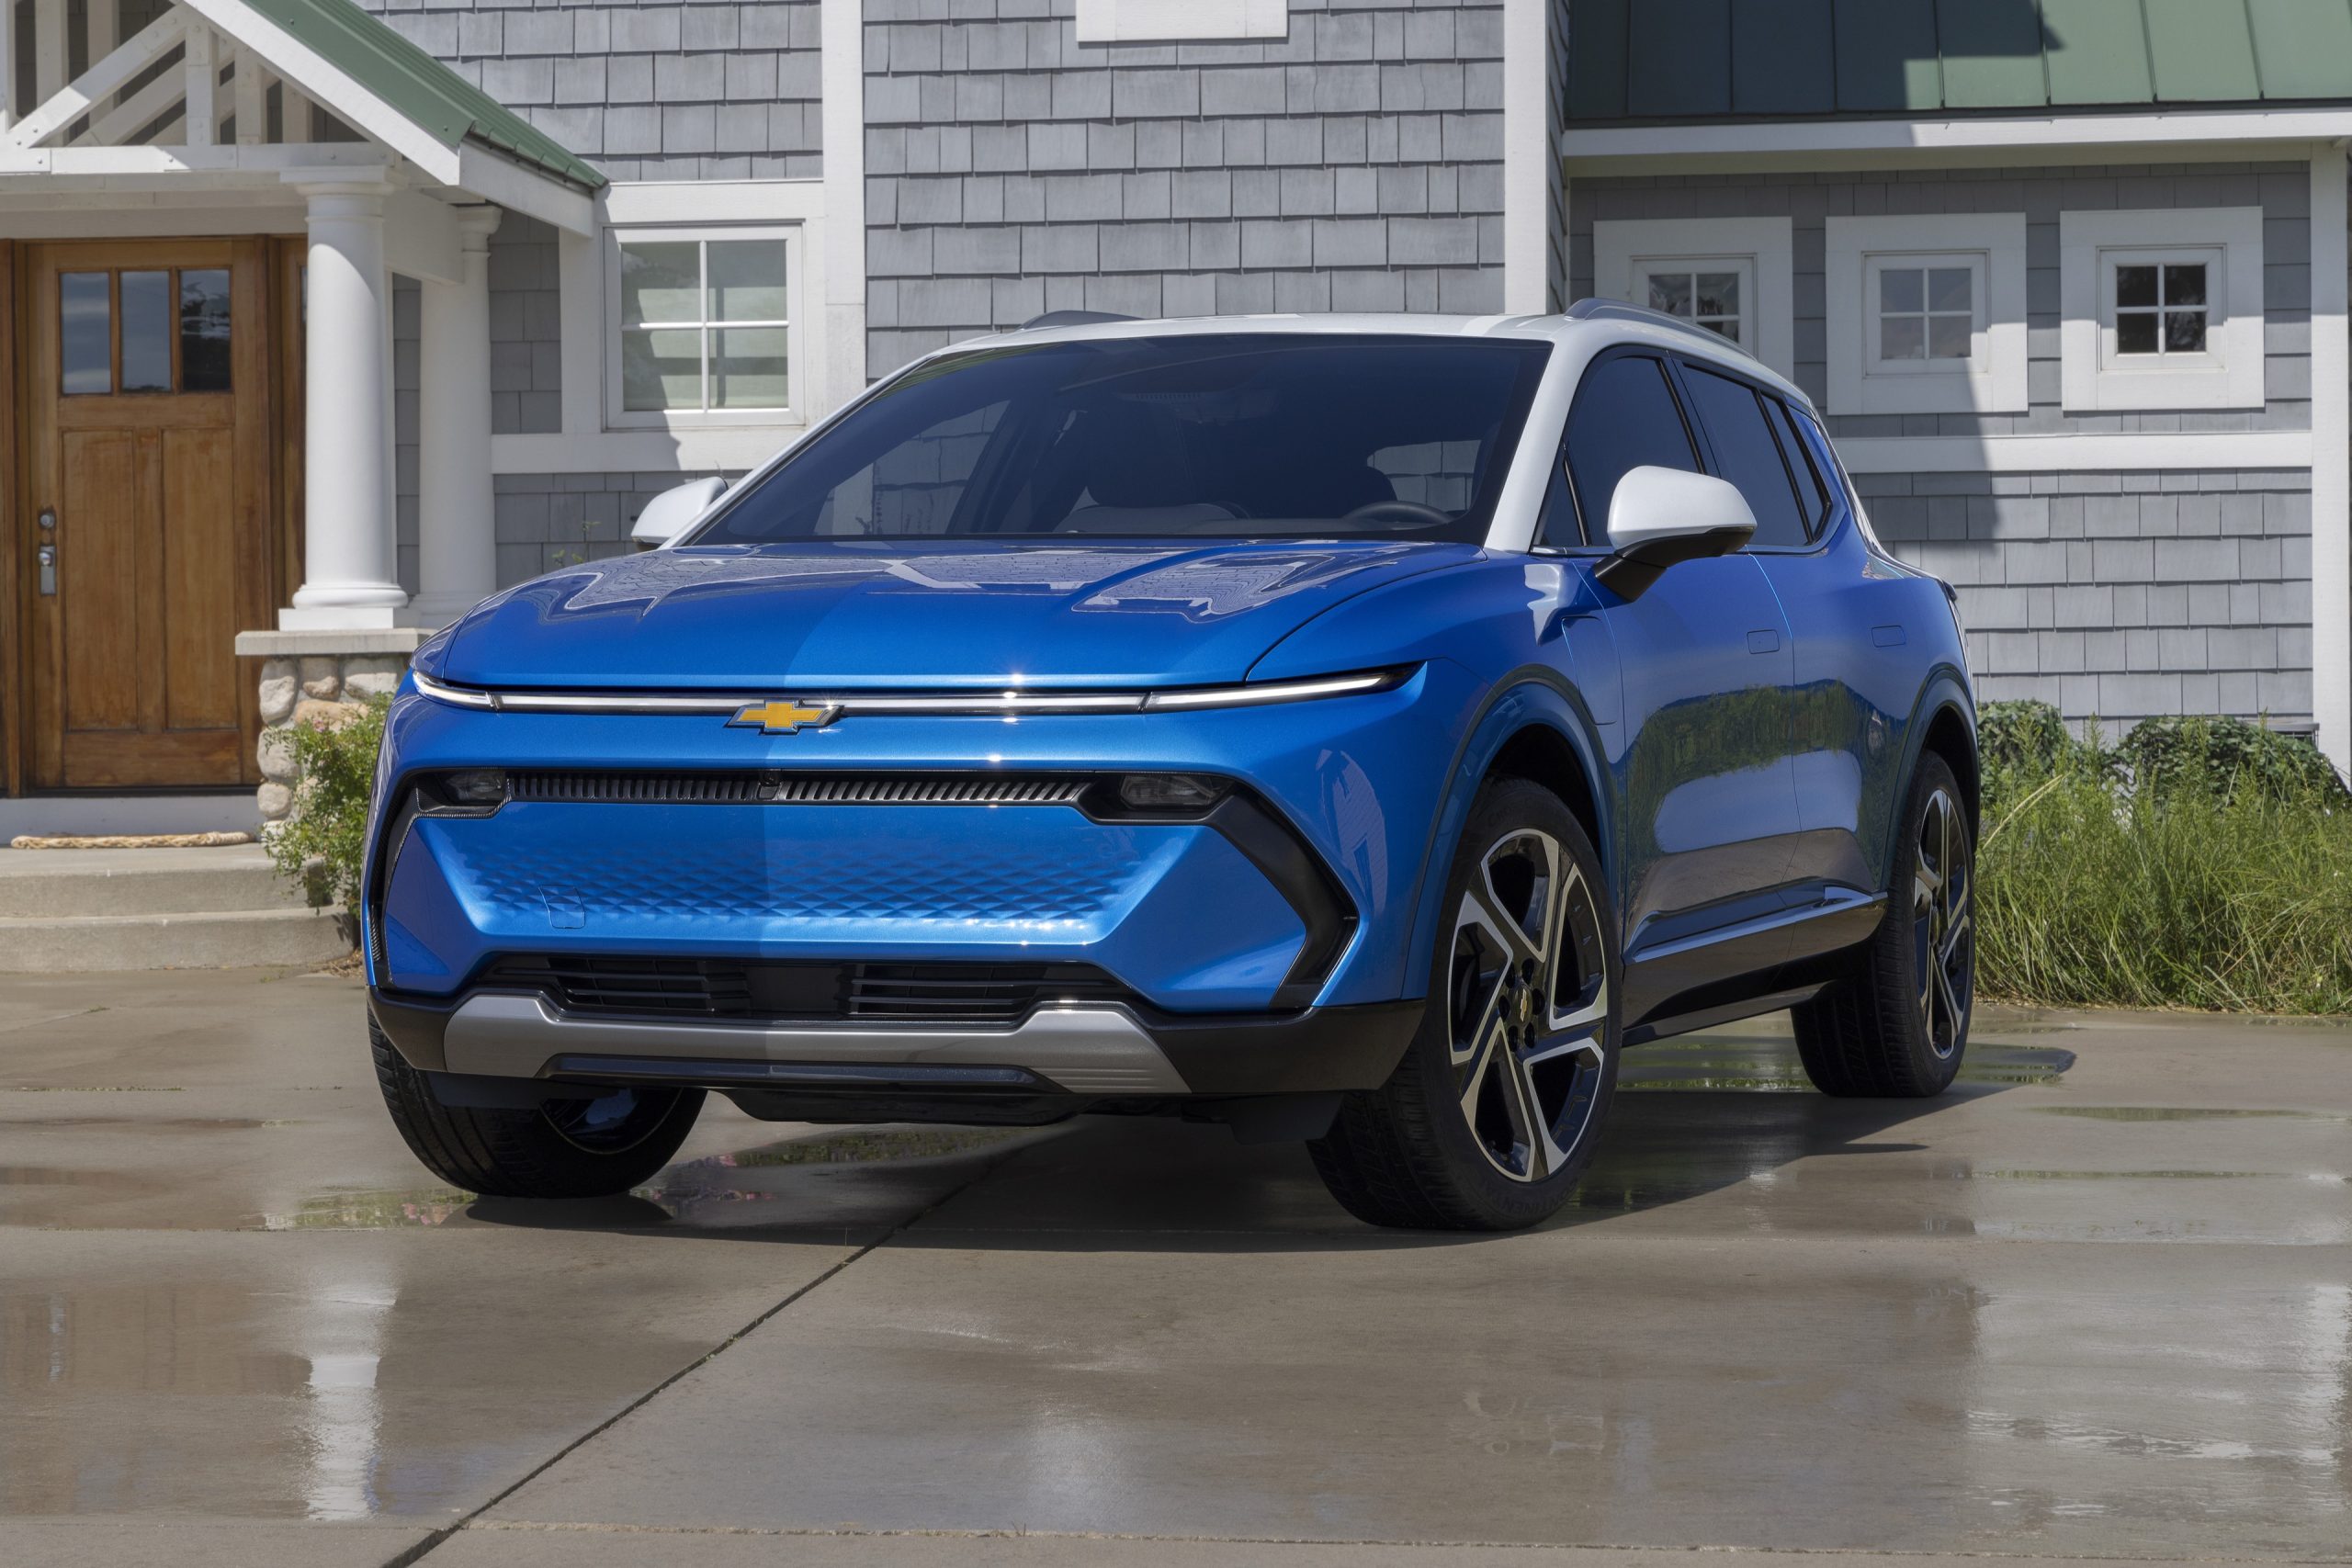
2025 Chevrolet Equinox EV 3LT parked in front of a home. Photo: Chevy Pressroom.
Ford announced a $19.5 billion writedown and killed the pure-electric F-150 Lightning. GM posted $7.6 billion in EV charges and delayed the Bolt indefinitely. Stellantis committed $13 billion to new gasoline models. Q3 2025 saw record EV sales as buyers rushed to capture expiring incentives. Then Q4 collapsed. Market share dropped from 9.5% to 5.7% in a single quarter.
The infrastructure kept growing anyway. The United States added 46 new DC fast charging ports every day in 2025. Total public ports now exceed 241,000 at 81,000 stations. The charging gap is closing even as sales stall. What matters now is where you live.
Colorado buyers can stack $15,000 in state incentives. Kentucky buyers get nothing. That gap defines EV ownership in 2026 more than any vehicle specification or brand loyalty ever could. This analysis ranks all 50 states plus DC for EV ownership viability. The results reveal an America splitting into two distinct automotive futures.
Key Takeaways
Best states for EV ownership in 2026: Colorado (#1), California (#2), Washington (#3), Oregon (#4), Connecticut (#5)
Federal EV tax credit status: Eliminated September 30, 2025. No federal incentives remain.
Top state incentives: Colorado up to $15,000; California up to $14,000; Connecticut up to $9,500
Worst states for EV ownership: Alaska (#50), Wyoming (#49), Montana (#48), Kentucky (#47)
Total U.S. EVs: 6.5 million (2.25% of vehicles on the road)
Charging infrastructure: 241,000 public ports at 81,000 stations
2026 outlook: Sales flat at 1.3 million; market share dropping to ~6%
The 2026 EV Market: Headwinds Multiply
Three forces are converging to slow U.S. EV adoption.
Federal Incentives Gone
The $7,500 new EV tax credit terminated for vehicles acquired after September 30, 2025. The $4,000 used EV credit ended the same day. The 30% charging equipment credit expires June 30, 2026. No replacement programs exist at the federal level.
Tariffs Compound Costs
Chinese EVs face a 100% import tariff, established under Biden and maintained under Trump. Starting April 3, 2025, all imported vehicles and auto parts face an additional 25% tariff regardless of origin. These tariffs effectively block affordable Chinese EVs that sell for under $15,000 in other markets from reaching American buyers.
Manufacturers Retreating
Ford canceled the pure battery-electric F-150 Lightning. The next-generation Lightning will use a gasoline range extender. Ford’s Blue Oval City in Tennessee, originally planned for 500,000 annual EV trucks, will now produce ICE vehicles. The company revised its 2030 EV sales forecast from 45% down to 9-18%.
GM is cutting Cadillac Lyriq and Vistiq production through mid-2026, suspending shifts and laying off workers. The Chevy Bolt EV restart has been delayed indefinitely. Hummer EV and Escalade IQ production is slowing.
Stellantis discontinued the Ram EV pickup. The Ramcharger EREV is delayed to late 2026. The company announced $13 billion for new ICE models while cutting its entire PHEV lineup for 2026.
2026 Sales Forecast
Cox Automotive projects 1.3 million EV sales in 2026, roughly flat with 2025. Edmunds forecasts EV market share dropping to approximately 6%, down from 7.5% in 2025. The overall U.S. auto market is expected to decline 2.4% to 15.8 million units.
Ranking Methodology
Five categories determine each state’s score:
EV Market Share (25 points): Percentage of new vehicle sales that are electric. Source: Alliance for Automotive Innovation Q3 2025.
Charging Infrastructure (25 points): Public ports per registered EV and total availability. Source: Alternative Fuels Data Center, January 2026.
Electricity Costs (20 points): Residential rates per kWh. Source: U.S. Energy Information Administration, October 2025.
State Incentives (20 points): Maximum available rebates and tax credits. Source: AFDC State Laws database.
NEVI Progress (10 points): Federal charging station deployment and funding awards. Source: Plug In America NEVI Tracker.
Complete Rankings: All 50 States + DC
RankStateScoreTierEV ShareElectricityState Incentives1Colorado63.1132.4%14.2¢Up to $15,0002California61.8129.1%33.60¢Up to $14,0003Washington58.41~17%12.67¢Sales tax exempt4Oregon57.21~14%13.1¢Up to $7,5005Connecticut56.81~11%27.84¢Up to $9,5006New Jersey56.11~13%18.4¢$4,000 + tax exempt7Massachusetts55.71~10%29.12¢$3,5008Vermont55.41~11%20.1¢$5,0009Nevada55.21~16%12.84¢Limited10New York55.01~9%24.3¢$2,00011District of Columbia54.22~21%15.8¢Limited12Maryland52.42~8%16.2¢$3,00013Rhode Island51.82~7%27.21¢Up to $4,00014Delaware50.62~10%14.9¢Limited15Arizona49.82~8%13.8¢Utility rebates16Illinois48.42~7%16.4¢$4,00017Virginia47.92~7%15.1¢Limited18Hawaii47.2211.1%39.74¢Limited19Minnesota46.82~6%15.6¢$2,50020Michigan46.12~10%18.9¢Limited21New Mexico45.62~5%14.7¢$3,00022Pennsylvania45.32~6%18.2¢None23Florida45.02~10%16.1¢None24Georgia44.82~6%14.5¢None25North Carolina44.23~5%14.8¢None26Texas43.83~6%15.2¢None; $200 fee27Utah42.43~5%12.52¢Limited28Ohio41.63~4%15.4¢None; $200 fee29Tennessee40.83~4%12.9¢None30Wisconsin40.23~4%17.1¢None31Indiana39.43~3%15.8¢None32Missouri38.83~3%14.2¢None33Iowa38.13~3%13.48¢None34Kansas37.43~2%14.6¢None35South Carolina36.93~3%14.6¢None36Nebraska36.23~2%13.13¢None37Oklahoma35.83~2%13.2¢None38Louisiana35.43~2%12.39¢None39Alabama35.13~2%14.8¢None40Idaho34.83~3%11.69¢None41Arkansas34.43~2%13.4¢None42West Virginia33.84~1%14.1¢None43North Dakota33.24<1%12.82¢None44South Dakota32.44<1%13.8¢None45Mississippi31.64~1%13.5¢None46New Hampshire30.84~4%24.8¢None47Kentucky29.44~2%12.9¢None48Montana28.24~2%12.4¢None49Wyoming26.84<1%12.6¢None50Alaska24.64~2%26.46¢None
Tier Key: 1 = Best (55+) | 2 = Solid (45-54.9) | 3 = Fair (35-44.9) | 4 = Challenging (<35)
Tier 1: Best Conditions (Score 55+)
These ten states offer the strongest combination of adoption, infrastructure, incentives, and electricity costs.
1. Colorado — Score: 63.1
Q3 2025 EV Share: 32.4% (highest single-quarter for any state ever)
Full-Year 2025: 27.3% of all new vehicle sales
Total EVs Registered: 210,000+
Electricity Cost: 14.2¢/kWh
State Incentives: Up to $15,000 for income-qualified buyers through stacked programs
Colorado hit 32.4% EV market share in Q3 2025. One in three new vehicles sold ran on electricity. The state responded to federal credit expiration by raising Vehicle Exchange Colorado rebates to $9,000 for new EVs and $6,000 for used. The state tax credit drops from $3,500 to $750 on January 1, 2026. The $2,500 bonus for vehicles under $35,000 MSRP remains. Population concentrates along the Front Range, where charging density matches coastal states. Outdoor culture has driven strong Rivian and F-150 Lightning adoption.
2. California — Score: 61.8
Q3 2025 EV Share: 29.1% (state record)
Q3 2025 ZEV Sales: 124,755 vehicles
Cumulative ZEV Registrations: 2.4 million+
Public Charging Ports: 200,000+ (26% of U.S. total)
Electricity Cost: 33.60¢/kWh
State Incentives: Up to $14,000 for income-qualified buyers
California sold 124,755 zero-emission vehicles in Q3 2025. EV sales jumped 30% from Q2 as buyers captured expiring federal credits. State incentives remain strong for income-qualified buyers. Clean Cars 4 All provides up to $12,000 for trading in a gas vehicle, plus $2,000 for charging equipment. The challenge: electricity costs 33.60¢/kWh, nearly double the national average. Annual charging costs exceed $1,200 for typical drivers.
3. Washington — Score: 58.4
Q3 2025 EV Share: ~17%
Electricity Cost: 12.67¢/kWh
State Incentives: Sales tax exemption on EVs under $45,000
Washington combines strong adoption with some of the nation’s cheapest electricity. Hydropower keeps rates low. The state adopted ACC II ZEV mandates effective with 2026 model year vehicles. Seattle metro drives most adoption. Eastern Washington lags significantly.
4. Oregon — Score: 57.2
Q3 2025 EV Share: ~14%
Electricity Cost: 13.1¢/kWh
State Incentives: $2,500 standard rebate; up to $7,500 income-qualified
Oregon’s Clean Vehicle Rebate Program provides $2,500 for most buyers. Income-eligible residents can receive up to $7,500. The state has committed to 50 new NEVI-funded fast charging stations. Round 2 applications closed February 2026. Portland metro shows strongest adoption. Rural eastern Oregon remains challenging.
5. Connecticut — Score: 56.8
Q3 2025 EV Share: ~11%
Electricity Cost: 27.84¢/kWh
State Incentives: Up to $9,500 through CHEAPR program
Connecticut’s CHEAPR program offers $2,250 standard rebates for EVs. Income-qualified buyers can add $2,000 (new) or $3,000 (used) through Rebate Plus. High electricity costs offset by strong incentives and dense charging infrastructure. Small geographic footprint means charging stations cover the state effectively.
6. New Jersey — Score: 56.1
Q3 2025 EV Share: ~13%
Total EVs Registered: 134,753
Electricity Cost: 18.4¢/kWh
State Incentives: Up to $4,000 rebate + sales tax exemption
New Jersey offers up to $4,000 in rebates through its Charge Up New Jersey program. The state exempts EVs from sales tax, adding another $2,000-$4,000 in effective savings. Dense population and short distances between cities make range anxiety minimal. Charging infrastructure ranks among the highest per square mile nationally.
7. Massachusetts — Score: 55.7
Q3 2025 EV Share: ~10%
Public Chargers: 8,426 (highest density per square mile nationally)
Electricity Cost: 29.12¢/kWh
State Incentives: MOR-EV rebates up to $3,500
Massachusetts has 8 public chargers per 10 square miles, the nation’s highest density. MOR-EV rebates provide up to $3,500 for new EVs and $3,500 for used. High electricity costs (29.12¢/kWh) are the primary drawback. Compact geography means infrastructure covers the state thoroughly.
8. Vermont — Score: 55.4
Q3 2025 EV Share: ~11%
Electricity Cost: 20.1¢/kWh
NEVI Fund Utilization: 60%
State Incentives: Up to $5,000 through Replace Your Ride
Vermont fell from #1 in October 2025 to #8. The state didn’t deteriorate. Colorado and California posted record quarters while Vermont’s small population limits growth potential. Replace Your Ride offers up to $5,000 for new EVs. Per-capita charging infrastructure remains among the nation’s best.
9. Nevada — Score: 55.2
Q3 2025 EV Share: ~16%
Electricity Cost: 12.84¢/kWh
State Incentives: Limited utility rebates
Nevada benefits from low electricity costs and strong Tesla presence. The Gigafactory near Reno drives local awareness and adoption. State-level incentives are minimal, but cheap power offsets that gap. Las Vegas metro shows strong adoption. Rural Nevada remains challenging.
10. New York — Score: 55.0
Q3 2025 EV Share: ~9%
Public Chargers: 15,890 (second nationally)
Electricity Cost: 24.3¢/kWh
State Incentives: Drive Clean Rebate up to $2,000
New York has 15,890 public charging stations, second only to California. Drive Clean Rebate provides up to $2,000, though funding availability fluctuates. New York City metro drives most adoption. Upstate shows lower rates. High electricity costs and modest incentives limit the overall score.
Tier 2: Solid Conditions (Score 45-54.9)
These states offer workable EV ownership with some limitations.
11. District of Columbia — Score: 54.2
Q3 2025 EV Share: ~21%
Electricity Cost: 15.8¢/kWh
State Incentives: Limited
DC has among the highest EV market shares nationally. Limited geography caps total impact. Excellent charging density within city limits.
12. Maryland — Score: 52.4
Electricity Cost: 16.2¢/kWh
Charger Density: 4 per 10 square miles
State Incentives: Excise tax credit up to $3,000
Strong charger density makes Maryland practical for EV ownership. Proximity to DC boosts adoption. Excise tax credit provides meaningful savings.
13. Rhode Island — Score: 51.8
Electricity Cost: 27.21¢/kWh
State Incentives: DRIVE EV rebate up to $2,500; income-qualified up to $4,000
High charger density due to small geography. Expensive electricity partially offset by rebates.
14. Delaware — Score: 50.6
Q3 2025 EV Share: ~10%
Electricity Cost: 14.9¢/kWh
State Incentives: Limited
Moderate electricity costs make Delaware workable for EV ownership. Limited state incentives. Small state means adequate coverage with fewer stations.
15. Arizona — Score: 49.8
Electricity Cost: 13.8¢/kWh
State Incentives: Utility rebates vary by provider
Low electricity costs benefit EV owners. Limited state-level incentives. Phoenix metro shows strong adoption; rural areas lag.
16. Illinois — Score: 48.4
Electricity Cost: 16.4¢/kWh
State Incentives: $4,000 rebate through June 2026; $2,000 after
Illinois Environmental Protection Agency offers $4,000 rebates through June 2026. Amount drops to $2,000 starting July 2026. Chicago metro drives most adoption.
17. Virginia — Score: 47.9
Electricity Cost: 15.1¢/kWh
State Incentives: Limited utility programs
NEVI deployment active along I-95 and I-81 corridors. Northern Virginia (DC suburbs) shows strongest adoption. Limited state-level incentives.
18. Hawaii — Score: 47.2
Q1 2025 EV Share: 11.1%
Electricity Cost: 39.74¢/kWh (nation’s highest)
NEVI Fund Utilization: 78%
State Incentives: Limited
Hawaii’s electricity costs 39.74¢/kWh, the nation’s highest. Yet EV share exceeds 11%. Gasoline regularly tops $5/gallon. The electricity-to-gas ratio still favors EVs. Island geography means 250 miles of range covers nearly every use case.
19. Minnesota — Score: 46.8
Electricity Cost: 15.6¢/kWh
State Incentives: $2,500 for new and used EVs
Department of Commerce offers $2,500 rebates for new and used EVs. Cold winters reduce range but don’t prevent adoption. Twin Cities metro leads.
20. Michigan — Score: 46.1
Q2 2025 EV Share: ~10%
Electricity Cost: 18.9¢/kWh
State Incentives: Limited utility programs
Domestic manufacturing hub with growing local adoption. GM and Ford presence drives awareness. Limited state incentives despite industry presence.
21. New Mexico — Score: 45.6
Electricity Cost: 14.7¢/kWh
State Incentives: $3,000 Clean Car Tax Credit through 2026
Clean Car Tax Credit provides $3,000 for new EVs, $2,500 for used, through 2026. Low electricity costs. Sparse population limits infrastructure density.
22. Pennsylvania — Score: 45.3
Public Chargers: 4,937
NEVI Fund Utilization: 66%
Electricity Cost: 18.2¢/kWh
State Incentives: None
Strong NEVI progress with 66% of funds awarded. No state incentives. Philadelphia and Pittsburgh metros lead adoption.
23. Florida — Score: 45.0
Q2 2025 EV Share: ~10%
Total EVs Registered: 254,878 (third nationally)
Public Chargers: 11,100 (fourth nationally)
Electricity Cost: 16.1¢/kWh
State Incentives: None
Florida offers zero state incentives but ranks third in total EV registrations. Population scale (22 million) generates large numbers even with modest adoption rates. Retirees relocating from EV-friendly states bring vehicles with them. Infrastructure has expanded rapidly. NEVI deployment continues.
24. Georgia — Score: 44.8
Public Chargers: 5,867
Electricity Cost: 14.5¢/kWh
State Incentives: None (ended 2015)
Georgia eliminated its $5,000 EV tax credit in 2015 and imposed a $200 annual fee. Adoption collapsed. Recovery has been slow. Atlanta metro shows gradual improvement.
Tier 3: Fair Conditions (Score 35-44.9)
EV ownership works in these states but requires more planning and commitment.
25. North Carolina — Score: 44.2
Electricity Cost: 14.8¢/kWh
State Incentives: None
NEVI deployment underway along I-95 and I-40. No state incentives. Charlotte and Raleigh-Durham metros lead.
26. Texas — Score: 43.8
Total EVs: 230,125 (fourth nationally)
Public Chargers: 10,629 (fourth nationally)
Electricity Cost: 15.2¢/kWh
State Incentives: None; $200 annual EV fee
Texas has 230,125 registered EVs and 10,629 public charging stations. Both rank fourth nationally. But Texas spans 268,596 square miles. Those stations must cover an area larger than France. The legislature imposed a $200 annual registration fee on EVs. Austin, Dallas, Houston triangle has adequate coverage. West Texas and Panhandle remain challenging.
27. Utah — Score: 42.4
Electricity Cost: 12.52¢/kWh
State Incentives: Limited
Low electricity costs benefit Utah EV owners. Limited state incentives. Salt Lake City metro concentrated adoption. Rural areas sparse.
28. Ohio — Score: 41.6
Electricity Cost: 15.4¢/kWh
State Incentives: None; $200 annual EV fee
Strong NEVI progress with Ohio leading early deployment. No state incentives. $200 annual EV fee. Cleveland, Columbus, Cincinnati corridors improving.
29. Tennessee — Score: 40.8
Electricity Cost: 12.9¢/kWh
State Incentives: None
Low electricity costs make Tennessee economical for EV ownership. Zero state incentives. Nashville and Memphis metros lead. Ford/GM manufacturing presence.
30. Wisconsin — Score: 40.2
NEVI Fund Utilization: 52%
Electricity Cost: 17.1¢/kWh
State Incentives: None
52% of NEVI funds awarded. No state incentives. Milwaukee metro leads.
31. Indiana — Score: 39.4
Electricity Cost: 15.8¢/kWh
State Incentives: None
Manufacturing hub with multiple EV plants. Sparse charging outside Indianapolis. No state incentives.
32. Missouri — Score: 38.8
Electricity Cost: 14.2¢/kWh
State Incentives: None
I-70 corridor charging improving. Kansas City and St. Louis metros adequate. Rural coverage thin. No state incentives.
33. Iowa — Score: 38.1
Electricity Cost: 13.48¢/kWh
State Incentives: None
Cheap electricity benefits Iowa EV owners. Rural coverage gaps. No state incentives. Des Moines area best served.
34. Kansas — Score: 37.4
Electricity Cost: 14.6¢/kWh
State Incentives: None
Low adoption rates across Kansas. I-70 corridor has coverage. Wichita and Kansas City areas workable. Rural areas challenging.
35. South Carolina — Score: 36.9
Electricity Cost: 14.6¢/kWh
State Incentives: None
NEVI funding active in South Carolina. No state incentives. Charleston and Greenville metros improving.
36. Nebraska — Score: 36.2
Electricity Cost: 13.13¢/kWh
State Incentives: None
Cheap electricity benefits Nebraska EV owners. I-80 corridor has stations. Omaha and Lincoln workable. Rural areas very limited.
37. Oklahoma — Score: 35.8
Electricity Cost: 13.2¢/kWh
State Incentives: None
Low charger-to-EV ratio across Oklahoma. Oklahoma City and Tulsa have coverage. No state incentives. Oil state politics hostile to EVs.
38. Louisiana — Score: 35.4
Infrastructure Density: 164 chargers per million residents (lowest nationally)
Electricity Cost: 12.39¢/kWh
State Incentives: None
Lowest infrastructure density nationally. Low electricity costs don’t offset sparse charging. New Orleans has limited coverage. Rest of state very sparse.
39. Alabama — Score: 35.1
Electricity Cost: 14.8¢/kWh
State Incentives: None
NEVI deployment starting in Alabama. No state incentives. Birmingham and Huntsville have some coverage. Hyundai/Mercedes EV manufacturing presence.
40. Idaho — Score: 34.8
Electricity Cost: 11.69¢/kWh
State Incentives: None
Very low electricity costs in Idaho. Sparse charging despite cheap power. Boise area workable. Rural Idaho extremely limited.
41. Arkansas — Score: 34.4
Electricity Cost: 13.4¢/kWh
State Incentives: None
Minimal infrastructure across Arkansas. No state incentives. Little Rock has limited coverage. Rest of state very challenging.
Tier 4: Challenging Conditions (Score Below 35)
EV ownership in these states requires significant commitment and planning.
42. West Virginia — Score: 33.8
Electricity Cost: 14.1¢/kWh
State Incentives: None
Coal-dependent grid in West Virginia. Limited charging. No incentives. Charleston area has minimal coverage. Mountain terrain complicates infrastructure.
43. North Dakota — Score: 33.2
Total EVs: ~400
Electricity Cost: 12.82¢/kWh (nation’s cheapest)
State Incentives: None
North Dakota has the cheapest residential electricity in America at 12.82¢/kWh. Yet the state has approximately 400 registered EVs total. Zero incentives, sparse population, and harsh winters combine to suppress adoption. Cheap electrons don’t help if there’s nowhere to charge.
44. South Dakota — Score: 32.4
Total EVs: ~700
Electricity Cost: 13.8¢/kWh
State Incentives: None
Approximately 700 EVs statewide in South Dakota. I-90 corridor has some stations. Sioux Falls has limited options. No incentives.
45. Mississippi — Score: 31.6
Electricity Cost: 13.5¢/kWh
State Incentives: None
Lowest adoption rates nationally in Mississippi. Minimal infrastructure. No incentives. Jackson area has very limited coverage.
46. New Hampshire — Score: 30.8
Electricity Cost: 24.8¢/kWh
State Incentives: None
No state incentives in New Hampshire. High electricity costs. Small population. Live-free-or-die politics resist EV mandates.
47. Kentucky — Score: 29.4
NEVI Fund Utilization: 59%
Electricity Cost: 12.9¢/kWh
State Incentives: None
Zero state incentives in Kentucky. Coal-dependent economy. 59% NEVI funds awarded, but deployment slow. Ford battery plant under construction may shift attitudes.
48. Montana — Score: 28.2
Electricity Cost: 12.4¢/kWh
State Incentives: None
Zero state incentives in Montana. Grid reliability issues during harsh weather. Vast distances between population centers. No utility rebates. Helena and Missoula have minimal coverage.
49. Wyoming — Score: 26.8
Total EVs: ~800
Electricity Cost: 12.6¢/kWh
State Incentives: None
Wyoming has roughly 800 registered EVs statewide. The state resisted federal NEVI guidelines in 2024, proposing alternative plans prioritizing tourist areas over interstate corridors. After threatening to refuse federal funding entirely, Wyoming eventually accepted revised guidance. Political opposition to EVs remains strong. Coal and oil industries dominate state politics.
50. Alaska — Score: 24.6
Electricity Cost: 26.46¢/kWh
NEVI Allocation: $52 million (approved October 2025)
State Incentives: None
Alaska’s electricity grid has literal gaps. Many rural communities operate on isolated microgrids. Between connected areas lie regions with no power infrastructure at all. Extreme cold reduces EV range significantly. Distances between communities exceed most EV ranges. FHWA approved Alaska’s FY26 NEVI plan in October 2025, unlocking $52 million. Progress will be slow regardless. Geography and climate create barriers that policy cannot easily overcome.
Charging Infrastructure: January 2026
Per the Alternative Fuels Data Center (January 1, 2026): DC Fast Charging (Level 3)
67,916 public ports
14,623 stations
33% growth in 2025 (46.5 new ports daily)
Tesla Supercharger: 35,682 ports (52.5% share)
AC Level 2 Charging
172,911 public ports
66,558 stations
11.5% growth in 2025 (49 new ports daily)
Total: 241,000 public charging ports at 81,000 stations.
NEVI Program Status
The $5 billion federal NEVI program has underperformed. As of late 2025:
370+ stations operational at 80+ locations
States awarded contracts for ~4,000 DC fast ports at 990 sites
Only 16% of allocated funds obligated
The program was frozen in February 2025 after the Trump administration rescinded guidance. Seventeen states sued in May 2025. A federal court ruled the funding freeze violated the Impoundment Control Act. New interim guidance was released in August 2025. States with highest NEVI utilization: Maine (97%), Hawaii (78%), Pennsylvania (66%), Colorado (66%), Vermont (60%), Kentucky (59%).
Electricity Costs by State
U.S. Energy Information Administration, October 2025: National average: 17.98¢/kWh (up 5.2% year-over-year) Cheapest:
North Dakota: 12.82¢/kWh
Utah: 12.52¢/kWh
Washington: 12.67¢/kWh
Nebraska: 13.13¢/kWh
Iowa: 13.48¢/kWh
Most expensive:
Hawaii: 39.74¢/kWh
California: 33.60¢/kWh
Massachusetts: 29.12¢/kWh
Connecticut: 27.84¢/kWh
Alaska: 26.46¢/kWh
A typical EV driven 12,000 miles annually consumes roughly 3,600 kWh. Annual charging at North Dakota rates: $461 Annual charging at Hawaii rates: $1,431 The $970 annual spread compounds over vehicle ownership.
State Incentives Without Federal Support
With the federal credit gone, state programs determine effective purchase price. Strongest programs (income-qualified):
Colorado: Up to $15,000
California: Up to $14,000
Connecticut: Up to $9,500
Oregon: Up to $7,500
Maine: Up to $8,000 (income-qualified only)
Standard rebates:
Illinois: $4,000 (through June 2026)
New Jersey: $4,000 + sales tax exemption
Massachusetts: $3,500
New Mexico: $3,000
Minnesota: $2,500
Oregon: $2,500 (standard)
New York: Up to $2,000
No state incentives: Kentucky, Montana, North Dakota, Wyoming, Florida, Texas, Mississippi, Alabama, Louisiana, Georgia, South Carolina, Tennessee, Ohio, Oklahoma, Arkansas, West Virginia, South Dakota, New Hampshire The gap between buying an EV in Colorado versus Kentucky now exceeds $15,000 for qualified buyers.
2026 Outlook
The American EV market faces a difficult year. Sales: Cox projects 1.3 million EVs, flat with 2025. Edmunds forecasts market share dropping to ~6%. Manufacturers: Ford, GM, and Stellantis are reducing EV investments. Range-extended EVs replacing pure battery models. Tariffs: 100% on Chinese EVs blocks affordable imports. 25% on all auto imports raises costs broadly. Infrastructure: Charging networks expand regardless of sales trends. Tesla, Rivian, Mercedes-Benz, Walmart, and bp pulse continue investing. State divergence: The gap between EV-friendly and EV-hostile states keeps widening.
The Verdict
Best conditions: Colorado, California (income-qualified), Washington, Oregon, Connecticut Workable: Most Northeastern states, Nevada, Arizona, Illinois, Minnesota Challenging: Texas, Florida, most Southern states Difficult: Wyoming, Montana, Alaska, Kentucky, Mississippi State policy now determines EV viability more than any other factor. These rankings quantify that reality.
Which State Should You Buy an EV In?
If you want maximum savings:
Colorado (through early 2026) or California (if income-qualified). Both offer $14,000-$15,000 in stacked incentives. Colorado’s incentives decrease January 1, 2026.
If you want cheap charging costs:
Washington (12.67¢/kWh), Utah (12.52¢/kWh), or Idaho (11.69¢/kWh). These states have electricity rates 30-40% below the national average.
If you want the best charging infrastructure:
California (200,000+ public ports), Massachusetts (8 chargers per 10 sq mi), or New York (15,890 stations). Dense networks minimize range anxiety.
If you live in a state with no incentives:
Consider purchasing in a neighboring state with rebates if allowed, or focus on used EVs where depreciation has already occurred. Tesla, Rivian, and Hyundai often offer manufacturer incentives that apply regardless of state.
If you’re in a challenging state:
Home charging is essential. Install a Level 2 charger before purchase. Plan road trips carefully using apps like PlugShare or A Better Route Planner. Consider a plug-in hybrid for flexibility.
Frequently Asked Questions
What is the best state to own an electric car in 2026?
Colorado ranks as the best state for EV ownership in 2026, with a score of 63.1 out of 100. The state achieved a record 32.4% EV market share in Q3 2025 and offers up to $15,000 in combined state incentives for income-qualified buyers. California (#2), Washington (#3), Oregon (#4), and Connecticut (#5) round out the top five.
Is there still a federal EV tax credit in 2026?
No. The federal EV tax credit was eliminated on September 30, 2025, when Congress passed the One Big Beautiful Bill Act (OBBBA). The $7,500 new vehicle credit and $4,000 used vehicle credit are no longer available. The 30% charging equipment credit expires June 30, 2026.
Which states have the best EV incentives in 2026?
States with the strongest EV incentives in 2026 include: Colorado (up to $15,000), California (up to $14,000), Connecticut (up to $9,500), Oregon (up to $7,500), and Maine (up to $8,000 for income-qualified buyers). Most top incentives require income qualification.
Which states have no EV incentives?
Eighteen states offer no EV purchase incentives: Kentucky, Montana, North Dakota, Wyoming, Florida, Texas, Mississippi, Alabama, Louisiana, Georgia, South Carolina, Tennessee, Ohio, Oklahoma, Arkansas, West Virginia, South Dakota, and New Hampshire. Texas and Ohio also impose $200 annual EV registration fees.
How many public EV charging stations are there in the US?
As of January 2026, there are approximately 81,000 public EV charging stations with 241,000 total charging ports in the United States. This includes 67,916 DC fast charging ports and 172,911 Level 2 ports. California has the most with 200,000+ ports (26% of the national total).
What is the cheapest state to charge an electric car?
North Dakota has the cheapest residential electricity at 12.82¢ per kWh, followed by Utah (12.52¢), Washington (12.67¢), Nebraska (13.13¢), and Iowa (13.48¢). However, low electricity rates don’t guarantee good EV ownership conditions. North Dakota ranks #43 overall due to sparse charging infrastructure and zero incentives.
What is the most expensive state to charge an electric car?
Hawaii has the most expensive residential electricity at 39.74¢ per kWh, followed by California (33.60¢), Massachusetts (29.12¢), Connecticut (27.84¢), and Alaska (26.46¢). A typical EV driven 12,000 miles annually costs $1,431 to charge in Hawaii versus $461 in North Dakota.
How many electric cars are registered in the United States?
As of late 2025, there are 6.5 million electric vehicles registered in the United States, representing 2.25% of all vehicles on the road. California leads with over 2.4 million cumulative EV registrations, followed by Florida (254,878), Texas (230,125), and New Jersey (134,753).
Are EV sales increasing or decreasing in 2026?
EV sales are expected to remain flat or slightly decline in 2026. Cox Automotive projects 1.3 million EV sales, roughly even with 2025. Edmunds forecasts EV market share dropping to approximately 6%, down from 7.5% in 2025. The elimination of federal tax credits and manufacturer retreat from EV commitments are primary factors.
Why are automakers backing away from EVs?
Ford, GM, and Stellantis are reducing EV investments due to slower-than-expected demand, high production costs, and the elimination of federal incentives. Ford took a $19.5 billion writedown and canceled the pure electric F-150 Lightning. GM posted $7.6 billion in EV-related charges. Stellantis announced $13 billion in new ICE vehicle investments while cutting its PHEV lineup.
What are tariffs on electric vehicles in 2026?
Chinese EVs face a 100% import tariff, effectively blocking affordable Chinese models from the U.S. market. Additionally, all imported vehicles and auto parts face a 25% tariff regardless of country of origin, implemented April 3, 2025. These tariffs prevent American buyers from accessing sub-$20,000 EVs common in other markets.
What is the NEVI program?
NEVI (National Electric Vehicle Infrastructure) is a $5 billion federal program to build public EV charging stations along highways. As of late 2025, approximately 370 NEVI-funded stations are operational at 80+ locations. The program was temporarily frozen in February 2025 but resumed after a federal court ruling. States with the highest NEVI fund utilization include Maine (97%), Hawaii (78%), and Pennsylvania (66%).
Data Sources:
Article Last Updated: January 16, 2026.

Michael Kahn is the publisher of The Weekly Driver, serving as writer, photographer, and content creator. With a keen eye for storytelling and a passion for adventure, he specializes in uncovering the stories and experiences of automobile enthusiasts. Michael’s work is inspired by his love for off-the-beaten-path road trips, global exploration, and the pursuit of exceptional culinary experiences, all captured through the lens of a world traveler and automotive enthusiast.


