

Tesla stock price has dropped into a bear market, moving from the all-time high of $500 to the current $392. It has crashed by 21%, erasing billions of dollars in value. Still, on the positive side, the stock has formed a highly bullish chart pattern that may push it to an all-time high despite its valuation.
Tesla Stock Price Has Formed a Falling Wedge Pattern
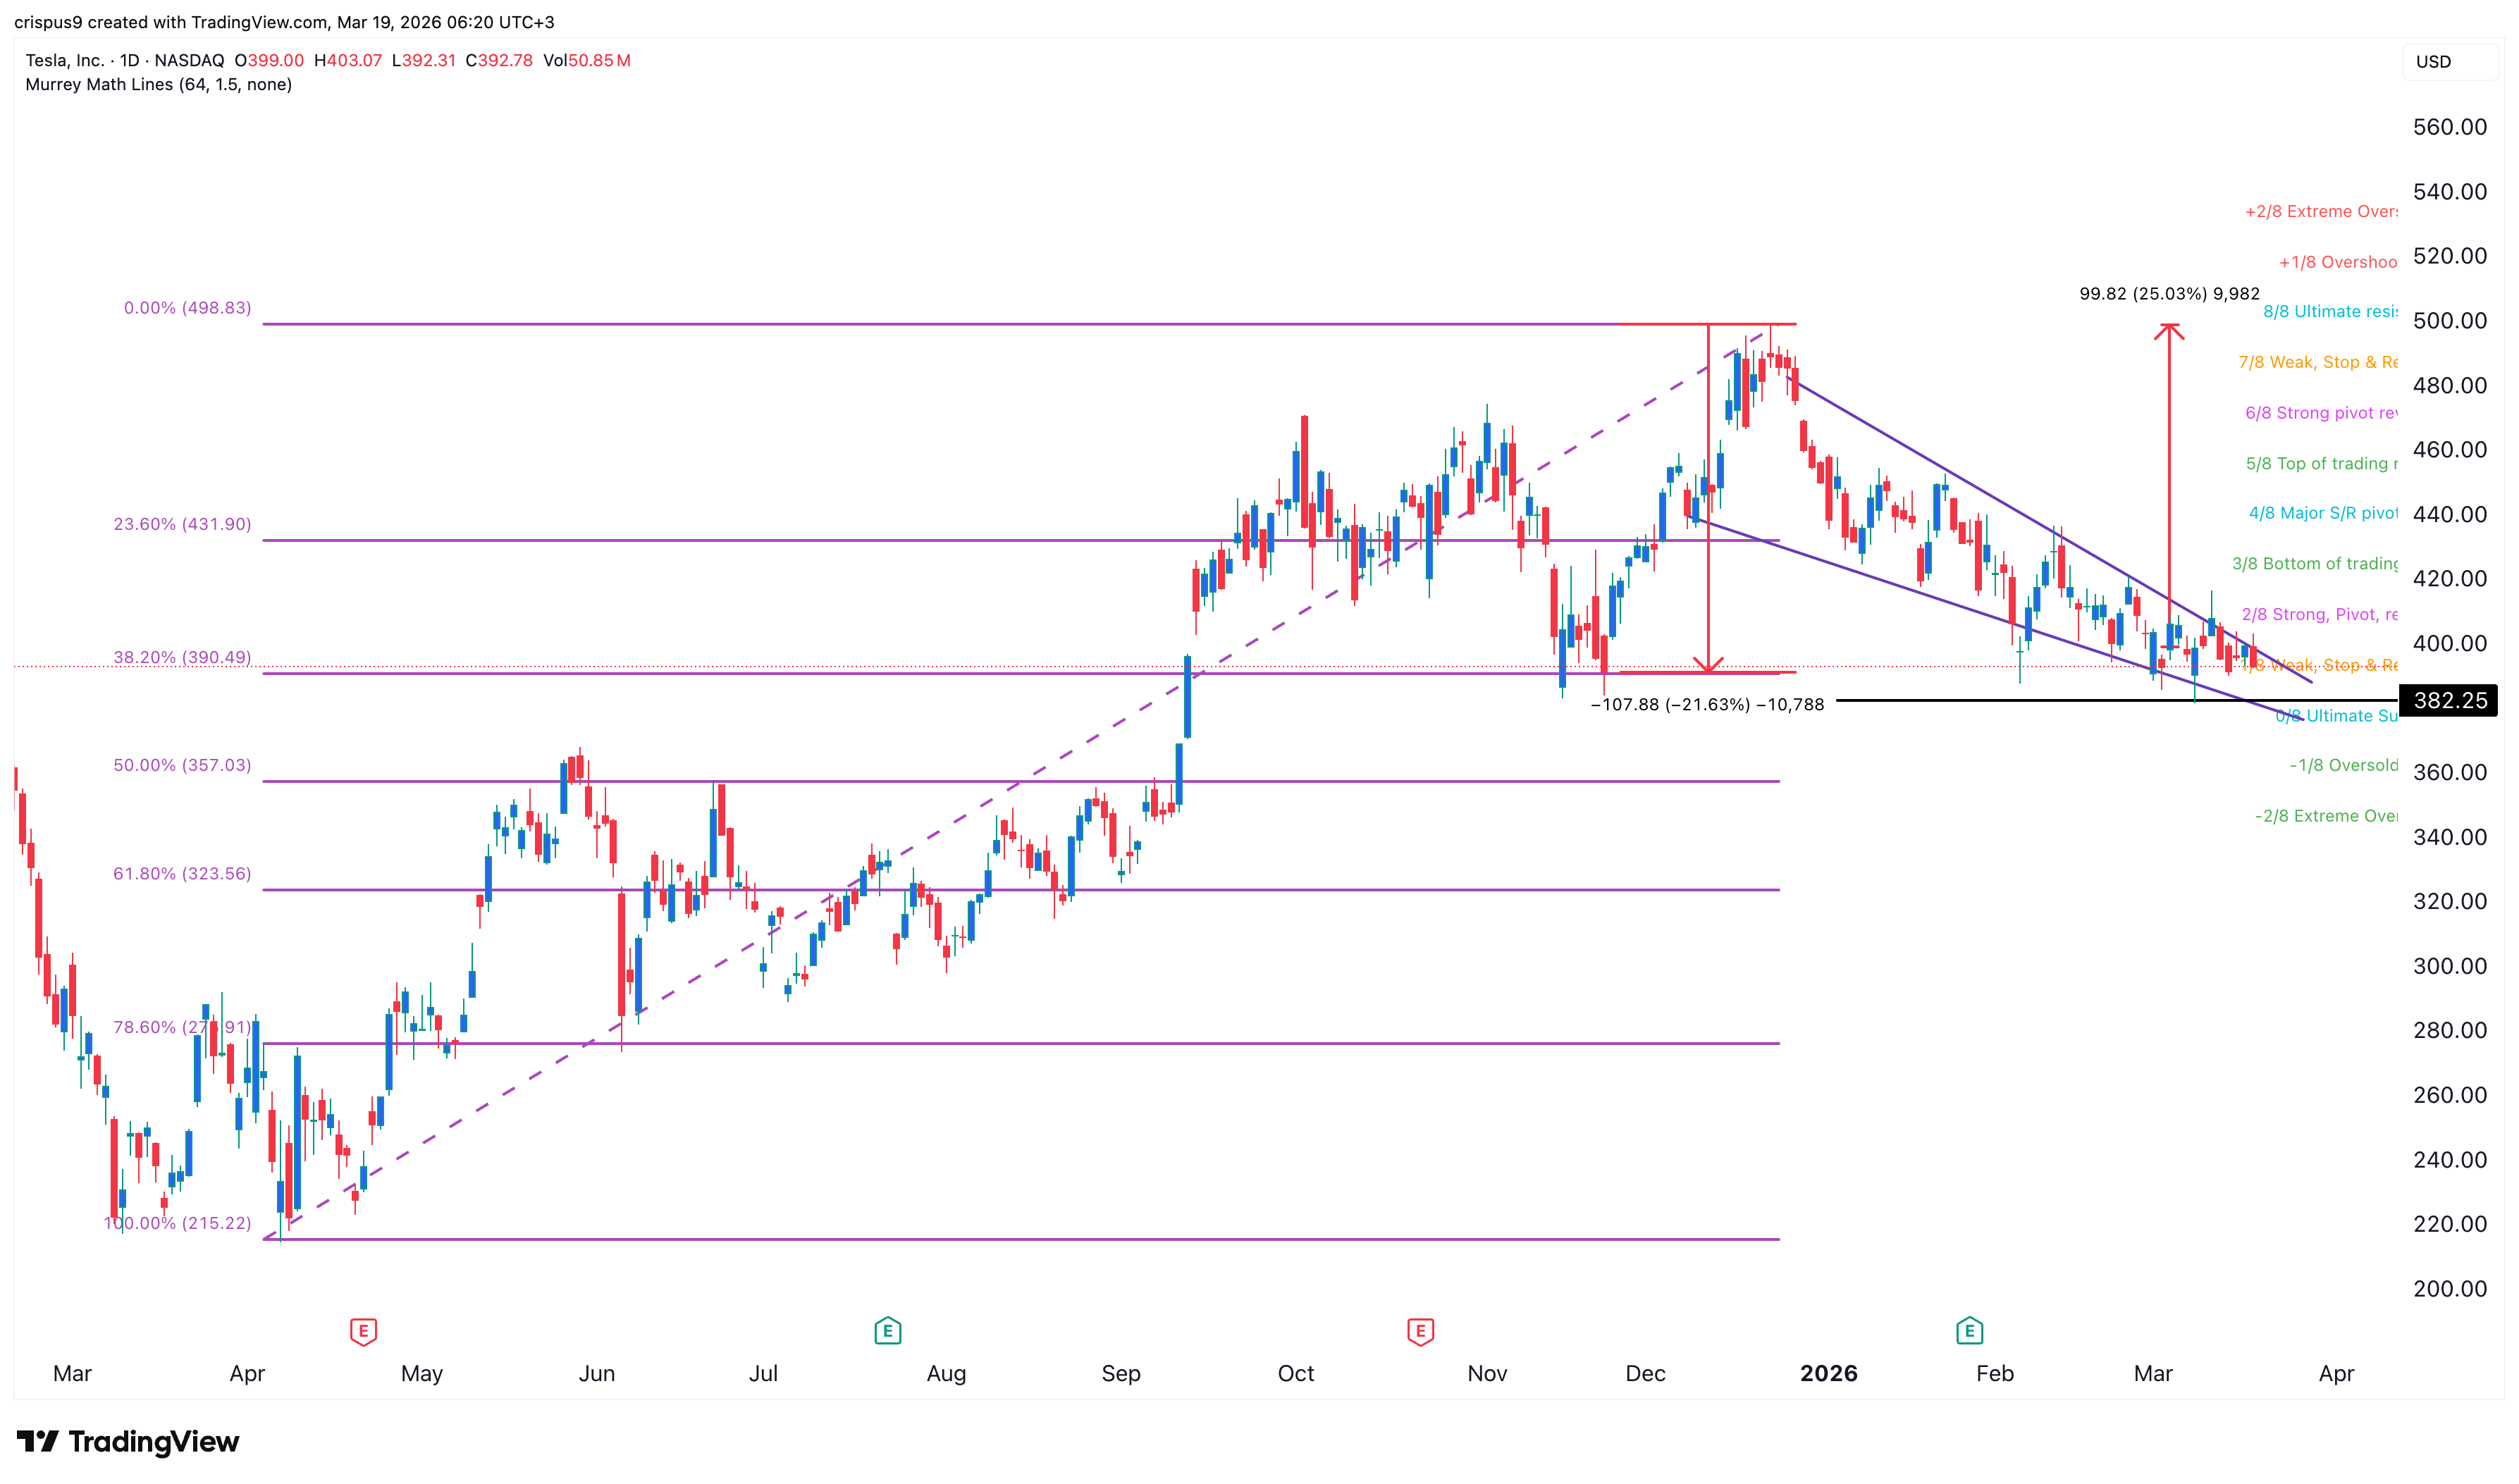
The daily chart shows that the TSLA stock price has made a series of lower lows and lower highs in the past few months. This retreat has pushed it below the 50-day moving average and the Supertrend indicator.
Still, on the positive side, the stock has fallen to the 38.2% Fibonacci Retracement level. It has resisted moving below this level several times since February this year.
Most importantly, the stock has formed a falling wedge pattern. This pattern is made up of two descending and converging trendlines, with the spread between the two narrowing. In most cases, this performance normally leads to a strong bullish breakout over time.
READ MORE: Coinbase Stock Price Eyes a 40% Surge as Key Catalysts Emerge
Therefore, the most likely TSLA stock price forecast is highly bullish as long as it remains above the 38.2% retracement level. Such a move may see it continue rising, potentially to the all-time high of $500. This price coincides with the Ultimate Resistance of the Murrey Math Lines tool.
On the hand, a drop below the key support level at $380 will be a sign that bears have prevailed, which may lead to a strong bearish breakdown, potentially to the 50% retracement level at $355.
 Tesla stock chart | Source: TradingView
TSLA is Highly Overvalued But Has Some Major Catalysts
Tesla has become one of the most overvalued companies in the United States, and to a large extent this price does not make sense. For one, it is a slow-growing automobile company that trades at a higher valuation than other fast-growing companies.
Tesla has a forward price-to-earnings ratio of 193 and a forward PEG ratio of 4. These numbers are much higher than the sector median of 14.7 and 1.46, respectively.
In contrast, NVIDIA, which is growing by double digits and will make over $1 trillion in revenue in the next few years, has a forward PE ratio of 22. It has a forward PE ratio of 0.58.
Similarly, Micron, a company experiencing strong revenue growth, has a forward PE ratio of 12. The S&P 500 Index has a forward multiple of 22.
Still, despite these challenges, the stock has more upside in the coming weeks or months. For one, the ongoing Iran war has pushed crude oil prices higher, with Brent jumping to $112 today. Gasoline and diesel prices have jumped to the highest level in over two years.
Therefore, there is a possibility that more American customers will move from Internal Combustion Engine (ICE) vehicles to electric vehicles, which are cheaper to maintain.
The company may also benefit from its autonomous vehicles and the ongoing investments in the artificial intelligence industry. Just this week, it entered a partnership with Samsung that will see it manufacture its chips.
READ MORE: Nebius Stock Price Crashed 10%: Top Reasons NBIS Will Rebound Soon


