
 Pricing Reflecting Its Growth Story After Recent Share Price Pullback")
Never miss an important update on your stock portfolio and cut through the noise. Over 7 million investors trust Simply Wall St to stay informed where it matters for FREE.
If you have ever wondered whether Tesla’s current share price matches its long term potential, you are not alone. This article focuses squarely on what the stock might be worth using several valuation lenses.
Tesla recently closed at US$405.94, with a 2.7% decline over the last 7 days, a 3.8% decline over the last 30 days, a 7.3% decline year to date, while the 1 year return sits at 45.4%, the 3 year at 123.0% and the 5 year at 82.3%.
Recent headlines around Tesla have continued to center on its role as a major electric vehicle maker and its visibility in discussions about large cap growth stocks. These themes often shape how investors think about risk, which can influence how the market prices the shares at any point in time.
On our valuation checks Tesla currently scores 0 out of 6. We will walk through what different valuation approaches say about that score and then finish by looking at a broader way to think about value that goes beyond a single number.
Tesla scores just 0/6 on our valuation checks. See what other red flags we found in the full valuation breakdown.
A Discounted Cash Flow model takes estimates of the cash Tesla could generate in the future and discounts those amounts back to today, to arrive at an estimate of what the business might be worth now.
For Tesla, the model used is a 2 Stage Free Cash Flow to Equity approach, based on cash flow projections. The latest twelve month Free Cash Flow is about $5.3b. Analyst and extrapolated projections in the model run out to 2035, with a forecast Free Cash Flow of $25.1b in 2030 and higher figures in later years, all converted into today’s dollars using a discount rate.
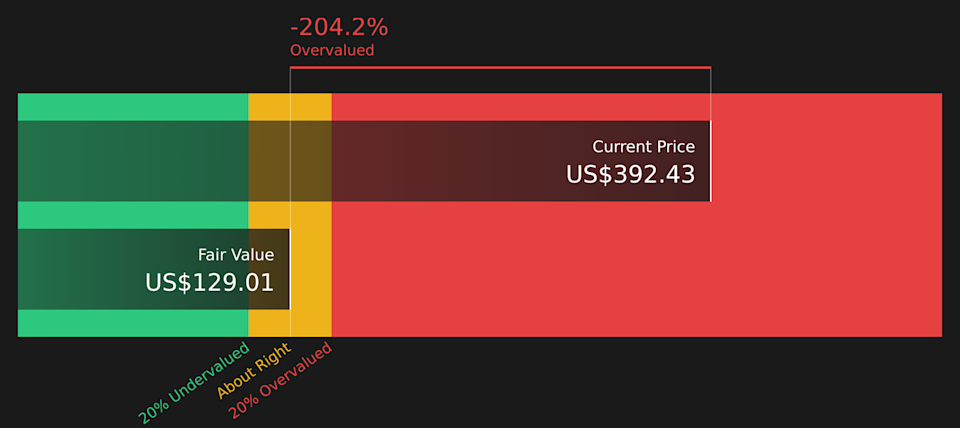
After summing all these discounted cash flows, the model arrives at an estimated intrinsic value of $128.92 per share. Compared with the recent share price of US$405.94, the DCF output suggests Tesla is very expensive, with an implied overvaluation of 214.9% on this set of assumptions.
Result: OVERVALUED
Our Discounted Cash Flow (DCF) analysis suggests Tesla may be overvalued by 214.9%. Discover 47 high quality undervalued stocks or create your own screener to find better value opportunities.
 TSLA Discounted Cash Flow as at Mar 2026
For profitable companies that also generate meaningful revenue, the P/S ratio can be a useful sense check because it compares what the market is paying for each dollar of sales, regardless of capital structure or accounting choices that affect earnings.
What counts as a fair P/S ratio usually reflects how much growth investors expect and how much risk they see in those future sales. Higher expected growth or stronger perceived resilience can support a higher multiple, while more uncertainty around the business tends to justify a lower one.
Tesla currently trades on a P/S ratio of 16.06x. That sits well above the Auto industry average P/S of 0.58x and the peer average of 1.31x. Simply Wall St’s Fair Ratio for Tesla is 3.35x, which is its estimate of a suitable P/S multiple given factors such as growth profile, profit margins, industry, market cap and key risks.
This Fair Ratio is more tailored than a simple comparison with peers or the broad industry, because it adjusts for company specific characteristics rather than assuming Tesla should trade like an average Auto stock.
Comparing the Fair Ratio of 3.35x to the current P/S of 16.06x suggests Tesla shares are trading above that implied fair value range.
Result: OVERVALUED
 NasdaqGS:TSLA P/S Ratio as at Mar 2026
P/S ratios tell one story, but what if the real opportunity lies elsewhere? Start investing in legacies, not executives. Discover our 20 top founder-led companies.
Earlier we mentioned that there is an even better way to understand valuation, so let us introduce you to Narratives, which are simply your own story about Tesla, tied directly to numbers like fair value, future revenue, earnings and margins.
On Simply Wall St, Narratives live in the Community page and let you connect your view of Tesla, for example whether you see it as primarily an auto maker, an AI and robotics business, or something in between, to a financial forecast and then to a fair value that you can compare with the current share price.
Because Narratives sit on the platform used by millions of investors, they are easy to access and update, and they refresh automatically when new data, news or earnings are added, so your story and the numbers stay in sync rather than frozen at one point in time.
Looking at the Tesla Narratives already published, you can see this range clearly, with fair value estimates as low as about US$5 per share and as high as about US$2,708 per share, and the gap between those views helps you decide whether your own Narrative points you toward Tesla looking expensive, cheap, or somewhere in the middle when you compare your fair value to today’s price.
For Tesla however we will make it really easy for you with previews of two leading Tesla Narratives:
Across the community there are 24 Narratives on Tesla, with 11 arguing it looks undervalued and 13 suggesting it looks overvalued at around US$405.94 per share. Here is how two of the most followed examples frame the numbers.
🐂 Tesla Bull Case
Fair value in this Narrative: US$2,707.91 per share
Implied price gap to this fair value: around 85% below the Narrative estimate at the recent close
Revenue growth assumption used: 77%
Breaks Tesla into five large business lines, including Optimus robots, FSD and software, automotive, batteries and energy storage, and broader energy solutions, then aggregates them into a 2030 view.
Applies different 2030 P/E multiples to those profit estimates, discounts the outcomes back to today and arrives at fair value ranges from roughly US$2,120 to US$4,240 per share.
Frames Tesla as potentially heavily undervalued if it executes across AI, FSD and energy at scale, while still acknowledging execution, competition and regulation as key risks.
🐻 Tesla Bear Case
Fair value in this Narrative: US$322.21 per share
Implied price gap to this fair value: around 26% above the Narrative estimate at the recent close
Revenue growth assumption used: 18%
Focuses on Dojo, FSD and Megapacks as powerful technologies that could support growth, but questions how quickly and profitably these opportunities translate into cash flows.
Highlights practical hurdles around robotaxis and autonomy, including safety debates, regulation, hardware choices like camera only systems, and a history of ambitious timelines.
Sees solid long term potential in areas like energy storage and software, yet still lands on a fair value below the current share price because of execution risks and uncertainty around key projects.
If you want to see these arguments in full, plus where other investors land between them, the best next step is to read the Narratives directly and decide which assumptions line up most closely with your own view of Tesla’s future.
Curious how numbers become stories that shape markets? Explore Community Narratives
Do you think there’s more to the story for Tesla? Head over to our Community to see what others are saying!
NasdaqGS:TSLA 1-Year Stock Price Chart
This article by Simply Wall St is general in nature. We provide commentary based on historical data and analyst forecasts only using an unbiased methodology and our articles are not intended to be financial advice. It does not constitute a recommendation to buy or sell any stock, and does not take account of your objectives, or your financial situation. We aim to bring you long-term focused analysis driven by fundamental data. Note that our analysis may not factor in the latest price-sensitive company announcements or qualitative material. Simply Wall St has no position in any stocks mentioned.
Companies discussed in this article include TSLA.
Have feedback on this article? Concerned about the content? Get in touch with us directly. Alternatively, email editorial-team@simplywallst.com


")

 Will Be Worth More Than Alphabet, Apple, Amazon, Tesla, Meta, and Microsoft Combined by 2030")
