
 Share Price Reflect Its Value After Recent EV Delivery Growth?")
Track your investments for FREE with Simply Wall St, the portfolio command center trusted by over 7 million individual investors worldwide.
If you are wondering whether NIO’s current share price reflects its real worth or just recent hype, this article walks through what the numbers actually say about value.
NIO’s stock most recently closed at US$4.95, with returns of 1.2% over 7 days, 5.1% over 30 days, an 11.5% gain over 1 year, but declines of 3.7% year to date, 51.4% over 3 years and 90.2% over 5 years.
Recent headlines around NIO have kept attention on the stock, including ongoing discussions about its position in the global electric vehicle space and its capital needs. These stories help frame why some investors see potential while others focus on risk.
NIO currently scores 1 out of 6 on our valuation checks. Next, we will walk through the usual valuation approaches and then finish with a different way of thinking about value that many investors overlook.
NIO scores just 1/6 on our valuation checks. See what other red flags we found in the full valuation breakdown.
A DCF model takes estimates of a company’s future cash flows, then discounts them back to today’s money to get an implied value per share. It is essentially asking what those future CN¥ cash flows are worth right now.
For NIO, the model used is a 2 Stage Free Cash Flow to Equity approach. The last twelve months free cash flow is a loss of about CN¥19,679.27m, so the model assumes the business is currently consuming cash rather than generating it. Analysts provide forecasts for the next few years, and Simply Wall St then extrapolates further, with projected free cash flow for 2030 of CN¥9,666m and discounted figures for each year through 2035.
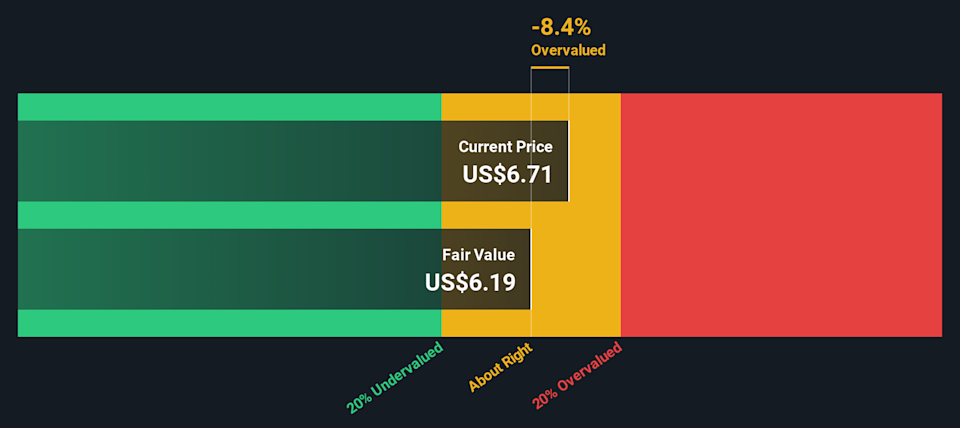
When all those projected CN¥ cash flows are discounted back and summed, the model arrives at an estimated intrinsic value of about US$4.90 per share. Compared to the recent share price of US$4.95, the model suggests NIO is roughly 1.1% overvalued, which is effectively a small gap.
Result: ABOUT RIGHT
NIO is fairly valued according to our Discounted Cash Flow (DCF), but this can change at a moment’s notice. Track the value in your watchlist or portfolio and be alerted on when to act.
 NIO Discounted Cash Flow as at Feb 2026
For companies that are not consistently profitable, P/S is often more useful than P/E because it compares the share price to revenue, which tends to be more stable than earnings. Investors usually accept a higher P/S ratio when they expect stronger revenue growth and lower risk, and a lower P/S when growth expectations are more modest or risks are higher.
Story Continues
NIO currently trades on a P/S ratio of 1.19x. That sits above the Auto industry average of 0.60x, but below the peer group average of 2.43x. To go a step further, Simply Wall St calculates a proprietary “Fair Ratio” for NIO of 1.11x. This is the P/S multiple that would typically be expected after accounting for factors such as the company’s growth profile, its industry, profit margins, market cap and risk characteristics.
This Fair Ratio can be more informative than a straight comparison with industry or peers because it adjusts for company specific drivers rather than assuming all Auto stocks deserve the same multiple. Compared to NIO’s actual P/S of 1.19x, the Fair Ratio of 1.11x suggests the shares are slightly above that modelled level, but the gap is small.
Result: ABOUT RIGHT
 NYSE:NIO P/S Ratio as at Feb 2026
P/S ratios tell one story, but what if the real opportunity lies elsewhere? Start investing in legacies, not executives. Discover our 23 top founder-led companies.
Earlier we mentioned that there is an even better way to understand valuation, so let us introduce you to Narratives. You can attach your own story about NIO to clear financial assumptions like revenue, earnings, margins and a fair value, then compare that fair value with the current price to decide whether you see NIO as closer to, for example, US$3.09 or US$9.23 per share. All of this is available within Simply Wall St’s Community page where millions of investors share views. Your Narrative then updates automatically as new earnings, news or guidance arrive so you always have a living, easy to follow link between NIO’s story, your forecast and the valuation you are using to guide your decisions.
For NIO however we will make it really easy for you with previews of two leading NIO Narratives:
First up is a bullish Narrative that sees more upside in the stock if certain business goals are met and the market is willing to pay up for that progress.
🐂 NIO Bull Case
Fair value in this bullish Narrative: US$18.27 per share
Implied discount to this fair value at the recent US$4.95 share price: about 73% undervalued using the Narrative’s own numbers
Revenue growth assumption: 51%
The author points to January 2025 deliveries of 13,863 vehicles, a 37.8% year on year increase, while also acknowledging shorter term volatility and pressure on margins.
They highlight NIO’s Battery as a Service model and expansion into Europe as key efforts aimed at supporting future positioning in the global EV market.
Analyst 12 month price targets between US$12 and US$18 are cited as context for why this Narrative’s fair value of US$18.27 is used, while also noting that outcomes could range from the stock staying around current levels to reaching US$10 to US$15 if things play out positively.
On the other side you have a bearish Narrative that leans toward a lower value for NIO, even if the business improves on today’s numbers.
🐻 NIO Bear Case
Fair value in this bearish Narrative: US$3.09 per share
Implied premium to this fair value at the recent US$4.95 share price: about 60% overvalued using the Narrative’s own numbers
Revenue growth assumption: 13.6%
The author focuses on risks from geopolitics, possible tariffs and export controls, oversupply in the Chinese EV market and ongoing margin pressure, all of which they see as headwinds for NIO’s international expansion and pricing power.
They also flag funding costs and capital intensity as constraints, and assume NIO would need to move from large losses today to earnings of CN¥5.1b by around September 2028, with profit margins closer to the US Auto industry average.
To justify the bearish fair value of US$3.09, the Narrative assumes NIO trades on a P/E of 16.9x in 2028 and notes this sits well below a consensus target of US$6.25, encouraging readers to compare these inputs with their own expectations before deciding which story feels more realistic.
Together, these two Narratives give you a clear sense of how different assumptions about growth, margins, funding and global risks can lead to very different fair values for the same US$4.95 share price. Your job is to decide which set of assumptions, if either, lines up with how you see NIO’s future.
Curious how numbers become stories that shape markets? Explore Community Narratives
Do you think there’s more to the story for NIO? Head over to our Community to see what others are saying!
NYSE:NIO 1-Year Stock Price Chart
This article by Simply Wall St is general in nature. We provide commentary based on historical data and analyst forecasts only using an unbiased methodology and our articles are not intended to be financial advice. It does not constitute a recommendation to buy or sell any stock, and does not take account of your objectives, or your financial situation. We aim to bring you long-term focused analysis driven by fundamental data. Note that our analysis may not factor in the latest price-sensitive company announcements or qualitative material. Simply Wall St has no position in any stocks mentioned.
Companies discussed in this article include NIO.
Have feedback on this article? Concerned about the content? Get in touch with us directly. Alternatively, email editorial-team@simplywallst.com


