
 Run Too Far After Recent 5 Year 55% Share Price Gain?")
If you have ever wondered whether Tesla’s share price still lines up with the underlying business, you are not alone. This article is written with that exact question in mind. Tesla’s shares most recently closed at US$437.50, with a 1.7% decline over the last 7 days, a 9.5% decline over 30 days, a 0.1% decline year to date, a 2.6% gain over 1 year and a very large 3 year return, alongside a 55.0% return over 5 years. Recent news coverage has centered on Tesla’s position in the electric vehicle market and its broader role in clean energy. This continues to attract close attention from both retail and institutional investors. Headlines around competition, regulatory developments and product updates help set the backdrop for how investors are thinking about the current share price. Tesla currently has a valuation score of 0 out of 6. We will look at what different valuation models say about that score, before finishing with a way to frame valuation that goes beyond the usual checklists.
Tesla scores just 0/6 on our valuation checks. See what other red flags we found in the full valuation breakdown.
Approach 1: Tesla Discounted Cash Flow (DCF) Analysis
A DCF model takes estimates of a company’s future cash flows, discounts them back to today using a required return, and adds them up to get an estimated value per share.
For Tesla, the latest twelve month Free Cash Flow is about $6.40b. The model used here is a 2 Stage Free Cash Flow to Equity approach, which relies on analyst estimates out to 2030 and then extends those projections further. By 2030, projected Free Cash Flow is $31.68b, with ten year projections ranging from $4.09b in 2026 to $66.67b in 2035, all expressed in dollar terms and then discounted back to today.
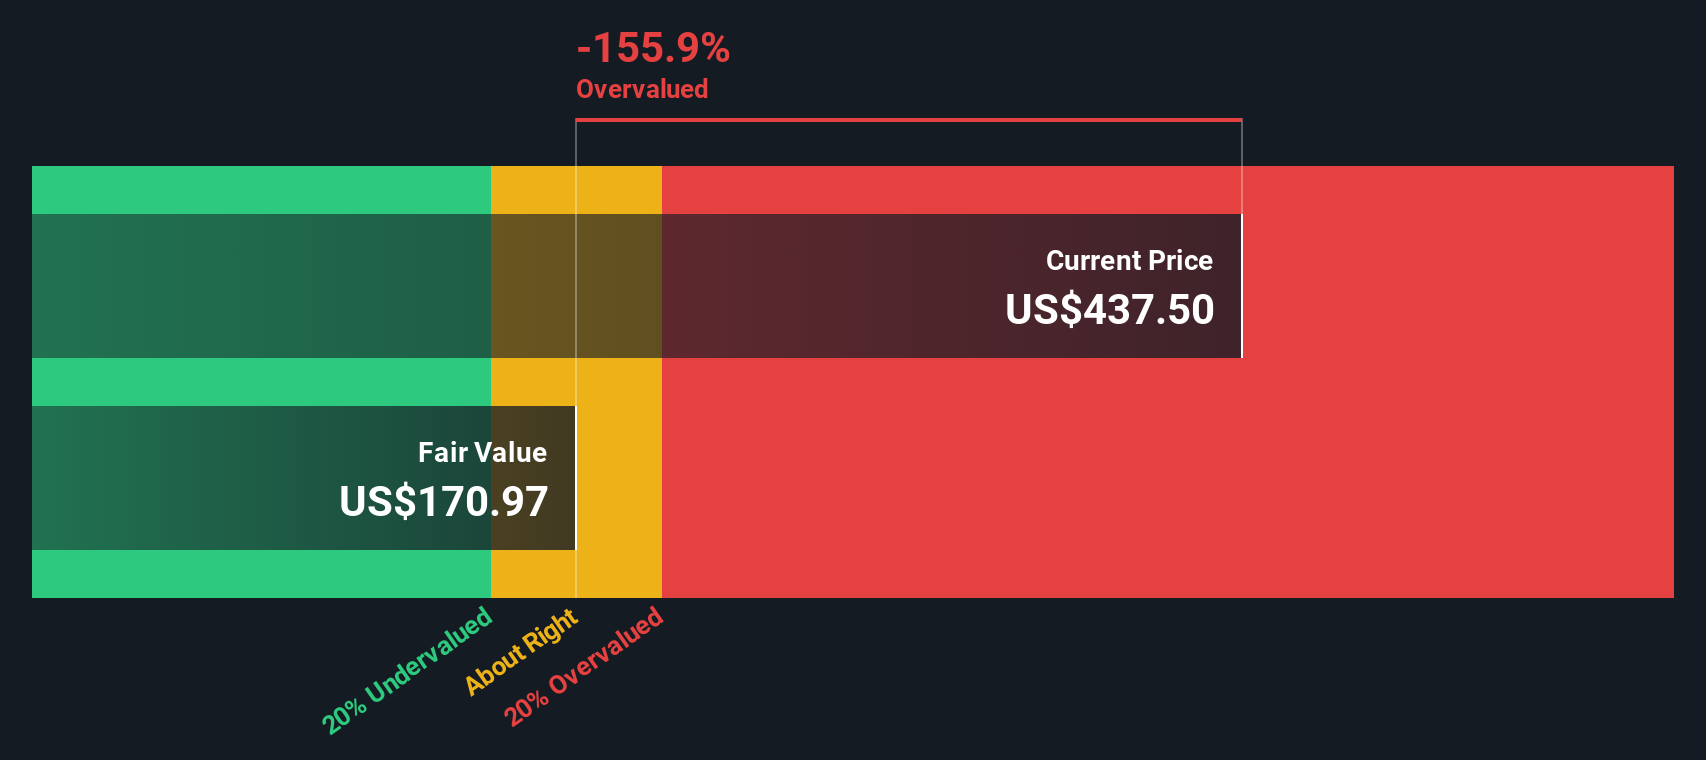
On this basis, the DCF model arrives at an estimated intrinsic value of US$170.97 per share, compared with the recent share price of US$437.50. That gap implies the shares are about 155.9% above the model’s estimate, which points to a wide disconnect between the DCF result and the current market price.
Result: OVERVALUED
Our Discounted Cash Flow (DCF) analysis suggests Tesla may be overvalued by 155.9%. Discover 871 undervalued stocks or create your own screener to find better value opportunities.
 TSLA Discounted Cash Flow as at Jan 2026
Approach 2: Tesla Price vs Sales
For profitable companies that are still heavily focused on growing revenue, the P/S ratio can be a useful way to think about what you are paying for each dollar of sales, especially when earnings can swing around due to investment and one off items.
In simple terms, higher growth expectations and lower perceived risk usually justify a higher P/S multiple, while slower expected growth and higher risk typically point to a lower, more conservative range that investors might be comfortable with.
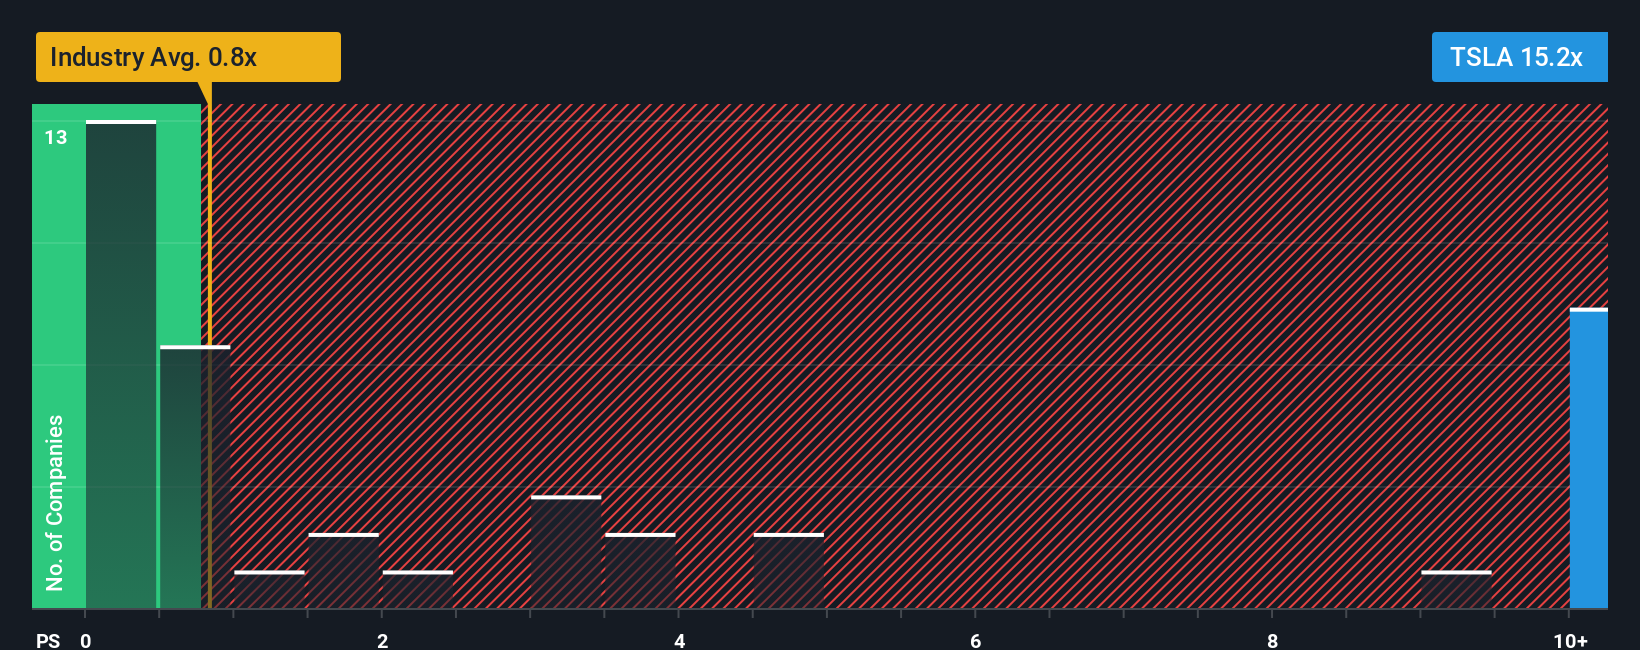
Tesla currently trades on a P/S ratio of 15.21x. That sits well above the Auto industry average of 0.82x and the peer average of 1.33x, which indicates the market is assigning a much richer sales multiple to Tesla than to many other auto related names.
Simply Wall St’s Fair Ratio for Tesla is 3.12x. This is a proprietary estimate of what a reasonable P/S might be, given factors such as earnings growth, profit margins, industry, company size and key risks. Because it looks at these company specific inputs rather than just simple comparisons, the Fair Ratio can provide a more tailored benchmark than broad industry or peer averages.
Comparing the Fair Ratio of 3.12x with the current P/S of 15.21x indicates that Tesla shares are trading well above that implied range.
Result: OVERVALUED
 NasdaqGS:TSLA P/S Ratio as at Jan 2026
P/S ratios tell one story, but what if the real opportunity lies elsewhere? Discover 1442 companies where insiders are betting big on explosive growth.
Upgrade Your Decision Making: Choose your Tesla Narrative
Earlier we mentioned that there is an even better way to understand valuation, so let us introduce you to Narratives, a simple way for you to attach a clear story about Tesla to the actual numbers you care about, like fair value estimates and assumptions for future revenue, earnings and margins.
A Narrative on Simply Wall St links three things in one place: your view of Tesla’s story, the financial forecast that flows from that view, and the fair value that falls out of those numbers, all inside an easy tool on the Community page that is already being used by millions of investors.
This matters because your Narrative can help you decide what to do by letting you compare your own Fair Value with today’s market price. It updates automatically as new earnings, news or other data arrives, so your view does not stay frozen in time.
For Tesla, one community member currently has a Fair Value of US$67.45 while another has US$2,707.91. This shows how two investors can look at the same company, build very different stories about AI, autonomy, energy and competition, and then turn those stories into very different numbers.
For Tesla however we will make it really easy for you with previews of two leading Tesla Narratives:
Fair value: US$2,707.91
Implied undervaluation vs US$437.50: about 84%
Revenue growth assumption: 77%
Breaks Tesla into five parts, including Optimus robots, energy storage, FSD and software, automotive and solar or grid solutions, and builds a 2030 view from those pieces. Arrives at very high 2030 revenue and profit estimates, then applies different P/E multiples to those earnings and discounts the values back to today. Concludes that the current share price is far below the estimated range, while also flagging risks around competition, execution and regulation.
Fair value: US$332.71
Implied overvaluation vs US$437.50: about 31%
Revenue growth assumption: 30%
Highlights a long list of potential growth drivers, including Cybertruck, Roadster 2.0, a lower priced Model 2 or Model Q, Tesla Semi, Optimus and FSD subscriptions. Sets out revenue and earnings estimates in the US$150b and US$15b range within several years, with assumed profit margins around 20% and P/E ratios in the mid 20s. Spells out detailed risk factors, from supply chain and competition to regulation, safety investigations and valuation multiples that depend heavily on future execution.
Do you think there’s more to the story for Tesla? Head over to our Community to see what others are saying!
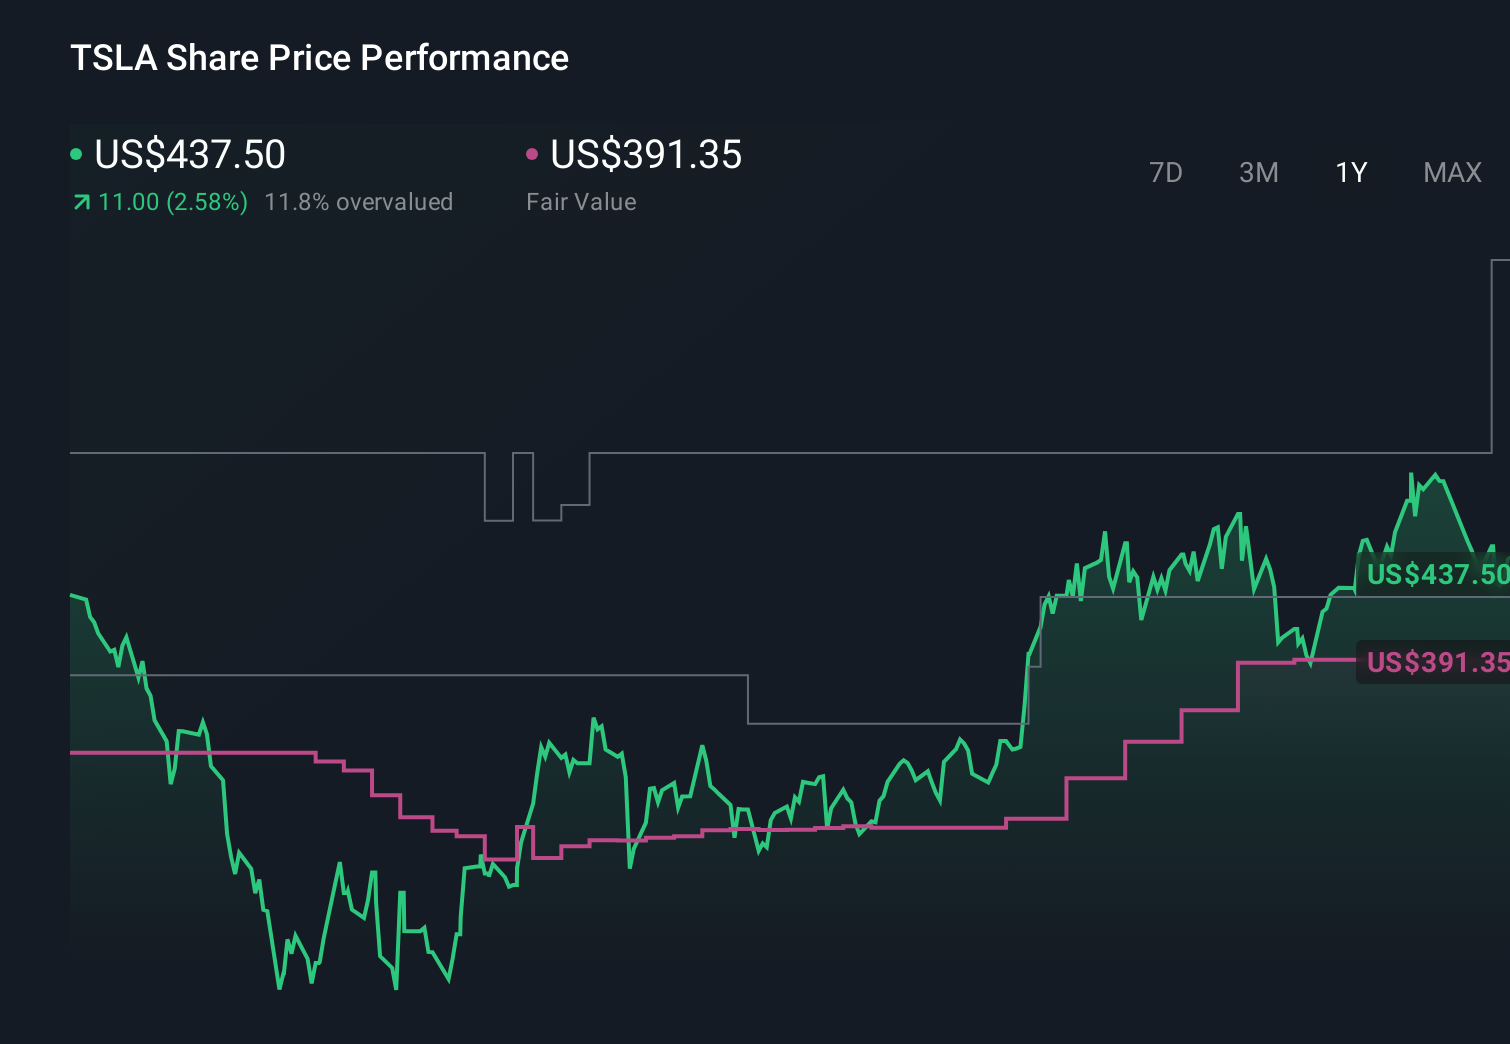 NasdaqGS:TSLA 1-Year Stock Price Chart
This article by Simply Wall St is general in nature. We provide commentary based on historical data
and analyst forecasts only using an unbiased methodology and our articles are not intended to be financial advice. It does not constitute a recommendation to buy or sell any stock, and does not take account of your objectives, or your
financial situation. We aim to bring you long-term focused analysis driven by fundamental data.
Note that our analysis may not factor in the latest price-sensitive company announcements or qualitative material.
Simply Wall St has no position in any stocks mentioned.
Valuation is complex, but we’re here to simplify it.
Discover if Tesla might be undervalued or overvalued with our detailed analysis, featuring fair value estimates, potential risks, dividends, insider trades, and its financial condition.
Have feedback on this article? Concerned about the content? Get in touch with us directly. Alternatively, email editorial-team@simplywallst.com


